
There comes a turning point in the life of every education reformer when he must confront the limitations of his work. Such an experience happened to me in July 2016, near Third Avenue and 149th Street, in the heart of the South Bronx.
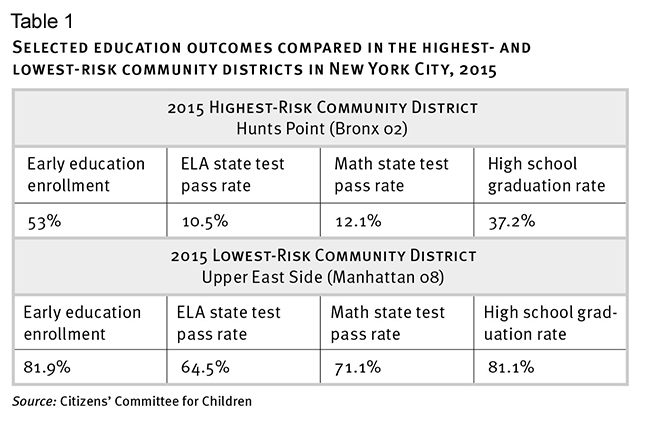
Earlier that year, I had read the 2015 Citizens’ Committee for Children’s annual ranking of New York City’s 59 Community Districts, based on 18 measures of child well-being. In education, the three categories are the share of three- and four-year-olds enrolled in early-education programs, passing rates on the state’s elementary and middle-school reading and math tests, and high school graduation rates. In 2015, among the 59 districts, the five showing the highest risk to child well-being were all located in the South Bronx. Table 1 illustrates the disparity between the highest-risk district, Hunts Point, and—less than two miles away—the lowest-risk district, on Manhattan’s Upper East Side.
Finally, a reason to check your email.
Sign up for our free newsletter today.
Around the same time, another study showed that at 90 New York City schools, not one black or Hispanic student had passed the 2014 state tests. Many of these schools were also located in the South Bronx. Indeed, by virtually every measure, educational opportunity in the South Bronx was in free fall and had been for generations.
Meantime, as CEO of Public Prep, a network of all-boys and all-girls public charter schools, I was immersed in discussions about where to locate our future schools. Given the need for more high-quality education options in the Bronx, as well as overwhelming demand for our Boys Prep and Girls Prep schools, we decided to concentrate our growth in the South Bronx. Thus, at the end of the 2015–16 school year, Public Prep moved its headquarters from tony Tribeca to the battered South Bronx. We leased an office that abuts an outreach center providing syringe exchange and mental health counseling to local drug addicts.
On that hot July afternoon, my team took a walking tour of the neighborhood. Along the way, we encountered a 27-foot-long, baby-blue Winnebago truck, that—judging by the cheery reaction of the people standing nearby—was a welcome fixture in the neighborhood. This was my turning point.
On the side of the truck, vividly inscribed in graffiti lettering, was the phrase “Who’s Your Daddy?” The truck turned out to be a mobile DNA testing center that charges $350 to $500 to answer questions such as: “Is she my sister?” or “Are you my father?” Demand had been so robust that the owner added a second truck so that he could offer Who’s Your Daddy? services in other boroughs and neighboring cities.
I was surprised that such a truck and its on-demand services even existed. But what astonished me more was the normalcy of its existence. The truck was clearly providing a needed function to the community. The owner describes why people used his service: “I realized that many of [my clients] were carrying around a huge burden—sometimes for decades. They live daily without the assurances that most people take for granted, such as: Who is my mother? Who is my brother? Am I really who I think I am?”
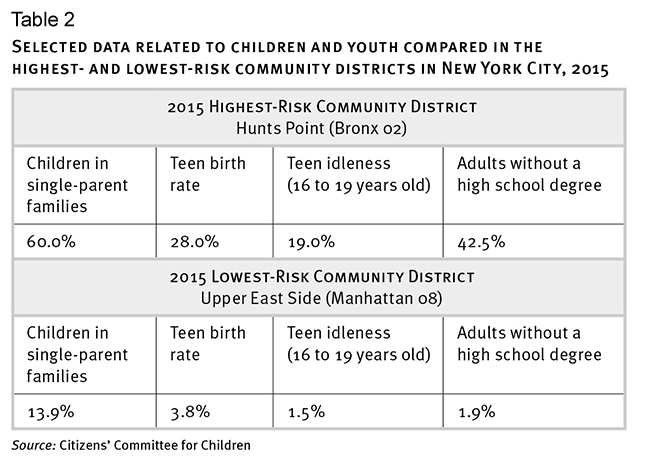
Why were so many people pondering such profound questions? I looked back at the CCC data to explore some additional categories related to children and youth. Table 2 displays some of what I found (again, comparing Hunts Point with the Upper East Side). Could it be that the educational disparities between these two districts were not just due to geography, economics, and race? Could it be, perhaps, that differences in family structure, as evidenced by the yawning gap in the percentage of children being raised in single-parent families, were a major explanatory factor for why education outcomes in the South Bronx have been so poor for so long?
Asking these questions led me down a path of no return.
I studied state health data related to all births and nonmarital births in the Bronx. In 2016, the nonmarital birth rate was 63 percent for all women and nearly 80 percent for women under 25. (Nonmarital birth data are not collected for men.) The second group represented 4,133 newborns in the Bronx who were probably going to be raised in single-parent households with unstable family structures, and very likely to suffer the same consequences represented in the CCC child well-being rankings.
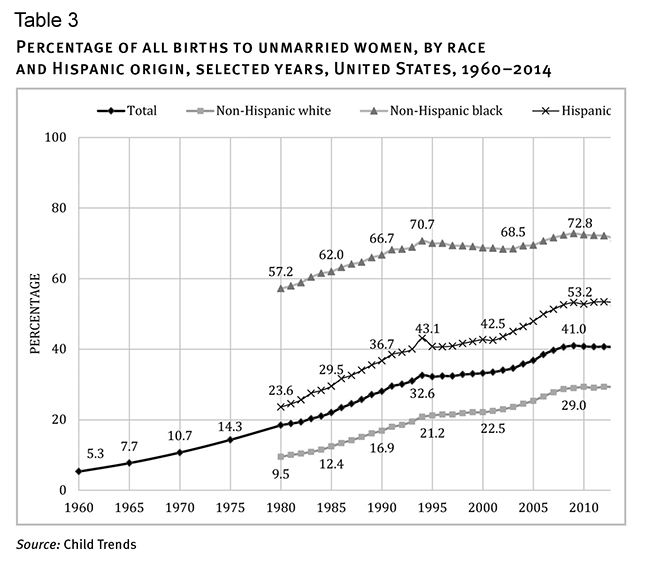
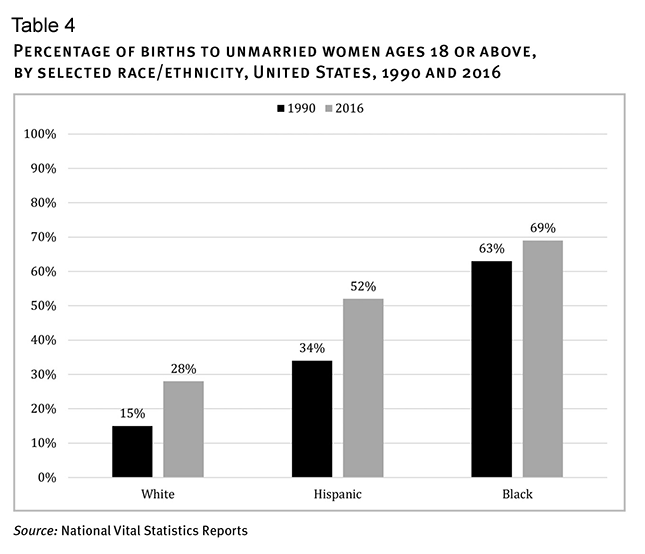
Continuing with my research, I discovered that what was happening in the Bronx was a microcosm of the United States. As shown in Table 3, we have seen a five-decade explosion in nonmarital birth rates among women of all races. And as Table 4 shows, over the past quarter-century, the rate of increase has been greatest among white and Hispanic women, though it remains high among African-American women, too.
I began to wonder how these staggeringly high nonmarital birth rates, particularly among young women, and the ensuing large numbers of children being raised in single-parent families, correlated with student-achievement outcomes—not only in the Bronx but also across New York and the nation. I turned to the New York State Education Department’s (NYSED) easy-to-use data site, which lets users filter state test and graduation data by factors including school, gender, race/ethnicity, migrant status, geographic district, English-language-learner status, economic status, and disability status. Yet it provides no way to disaggregate achievement data by family structure. No other states seemed to do so, either.
So I turned to the National Assessment of Educational Progress (NAEP) and its useful Data Explorer, which allows users to “create statistical tables, charts, maps” by grade, subject, and jurisdiction “to help . . . explore decades of assessment results, as well as information about factors that may be related to student learning.” As stipulated by the law, NAEP must “include information on special groups, including, whenever feasible, information collected, cross tabulated, compared, and reported by race, ethnicity, socioeconomic status, gender, disability and limited English proficiency.” And yet here, again, as in New York and the other 49 states, I found no way to review results by family structure, though it is clearly a “factor that may be related to student learning.”
Finally, I accessed the Data Quality Campaign (DQC), the nation’s foremost organization advocating for effective education-data policy and use. DQC’s underlying premise is that “When students, parents, educators, and policymakers have the right information to make decisions, students excel,” and as part of its work, the organization reviews state assessment systems. Take this excerpt from its 2017 Show Me the Data report:
[Eighteen] states do not disaggregate student performance by at least one legally required subgroup (including race, ethnicity, gender, English language learners, students with disabilities). In nine states, performance data is not disaggregated by any subgroup, which can hide achievement gaps and the students who need more support. It also keeps schools that are doing well with traditionally underserved students from being celebrated and emulated.
This is powerful feedback for states to improve the lenses through which student-achievement data are reported. Yet—once again—there’s no mention, much less criticism, of the fact that no state disaggregates such data by family structure.
It should not be this way. Major social changes, particularly in the family structures in which children are raised, have occurred over the last several generations. Yet measures of student achievement have stubbornly focused on race, class, gender, and geography. By disregarding family structure, the data obscure how this massive demographic shift might be an explanatory factor that rivals and perhaps overpowers other well-documented achievement gaps.
In its 2010 report, “Family Structure and Children’s Health in the United States,” the National Center for Health Statistics declared, “In view of the changing family structure distribution, new categories of families such as unmarried families or unmarried stepfamilies need to be studied so that the health characteristics of children in non-traditional families can be identified.”
The report defined seven distinct and mutually exclusive family structures: “nuclear,” “single-parent,” “blended,” “unmarried biological or adoptive families,” “cohabiting,” “extended,” and “other”—the last defined as a family consisting of one or more children living with related or unrelated adults who are not biological or adoptive parents (e.g., grandparents). The report observed that children showing the most consistently positive health outcomes were raised in nuclear families—that is, “living with two parents who are married to one another and are each biological or adoptive parents to all children in the family.”
Four years later, the same federal agency conducted another study to assess, by family-structure type, the likelihood of “adverse family experiences,” defined as potentially traumatic events or circumstances that children may have experienced that can have negative consequences lasting into adulthood. We see the results in Table 5.
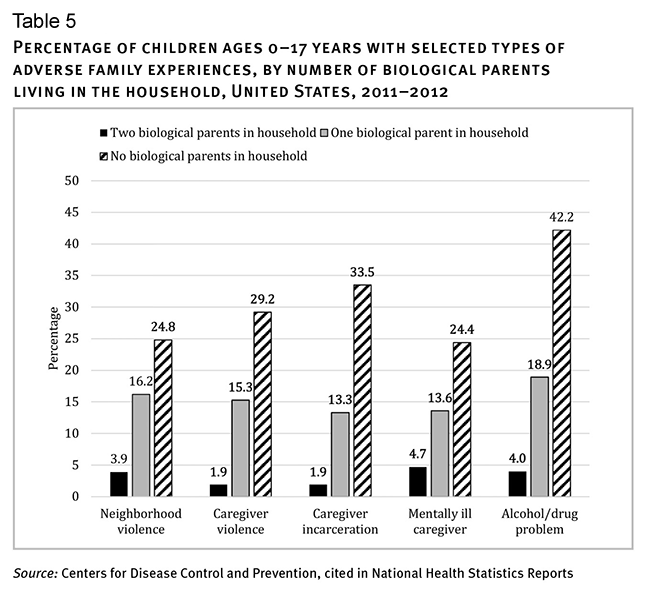
As the Center’s report states, “Children living with one biological parent were between three and eight times as likely as children living with two biological parents to have experienced neighborhood violence, caregiver violence, or caregiver incarceration or to have lived with a caregiver with mental illness, or an alcohol or drug problem.”
We also see that “in view of the changing family structure distribution,” health-care leaders and analysts have begun to study causal and correlational links between family structure and a range of child outcomes. These analyses are yielding new explanations for seemingly entrenched problems and ushering in a new wave of family-focused prescriptions in the health arena.
In education, on the other hand, even among ardent reformers and careful analysts doing their best to understand and do something about student-achievement gaps, family structure is virtually never considered as an important factor. In 2017, I called out Bill Gates for omitting the words “parent” and “family” from a 3,000-word essay, in which he lamented that, even after 17 years of investing billions of dollars in education reform, “by and large, schools are still falling short on the key metrics of a quality education.”
Months later, Bill and Melinda Gates released their 2018 annual letter, this one focused on the ten “toughest questions” that they get asked. Question Two: “What do you have to show for the billions you’ve spent on U.S. education?” They replied: “Unfortunately, although there’s been some progress over the past decade, America’s public schools are still falling short on important metrics, especially college completion. And the statistics are even worse for disadvantaged students.” No mention was made of the potential impact of family structure on this reality.
Yet more than half a century ago, the Coleman report, still widely considered the most important education study of the twentieth century, established the primacy of family structure and stability in children’s educational outcomes. Today, extensive evidence shows that children raised in stable, married, two-parent households (regardless of gender) have, on average, far superior life outcomes, not only in education but also in virtually every other category of human development. What’s strange about the silence on family structure is that the education-reform community and the charter school sector have already signaled that they understand the importance of family stability.
Analyses of poor educational outcomes that ignore family structure lead to misguided prescriptions. Take, for example, the Office for Civil Rights report “Data Collection on Early Childhood Education,” published in 2014, which found that “racial disparities in discipline begin in the earliest years of schooling. Black students represent 18 percent of preschool enrollment, but 42 percent of preschool students suspended once, and 48 percent of students suspended more than once.”
What could be causing such huge disparities by race when it comes to discipline? A 2017 Pew Research Center study shows that more than half (58 percent) of black children live with an unmarried parent, compared with 36 percent of Hispanic children and 24 percent of white children. Can anyone doubt that the absence of a second parent (most often the father) leads to behaviors that include acting out in school?
The problem is likely to grow worse. For 2017, the National Center for Health Statistics reports that the nonmarital birth rate for women under 25 was 71 percent. Fatherlessness affects every racial group, but it’s most acute in the black community, where nine out of ten babies born to women under 25 in 2017 were outside of marriage. The rate is 61 percent for white women under 25. More than 41 percent of unmarried women under 25 who gave birth in 2017 were bearing their second to eighth child.
In my rough estimate, unmarried young women who gave birth during 2017 were raising some 1.1 million children, creating enormous stress for these young mothers trying to hold it together. Nationwide, huge numbers of young single mothers are raising young children, in many cases multiple children, from different fathers, who often abandon their responsibilities. These children grow up in environments where they’re much more likely to experience the toxic stress that has lifelong, adverse consequences, and can lead to a generational treadmill of poverty and antisocial behavior.
Is it not possible that these differences in family structure, by race, represent a key factor in explaining the racial differences in disciplinary outcomes? We will never know unless we have the courage to ask.
Absent such data, a common explanation for this huge racial disparity in student discipline is that teachers are either explicitly or implicitly biased against black students. This assumes that some of the most talented, “woke” people in the country—teachers—who have committed themselves to improving the lives of disadvantaged children, are in fact discriminating on a racial basis, whether intentionally or not, against the very students whom they have sworn to educate.
A cottage industry has developed for anti-bias training. In New York City alone, Schools Chancellor Richard Carranza has committed $23 million to speed up such training for about 125,000 educators and employees, calling it a “cornerstone” of his plan to improve schools. Organizations like Teaching Tolerance and Border Crossers (renamed the Center for Racial Justice in Education) “train educators to #DISRUPTRACISM” and provide participants with opportunities to “identify instances where they themselves may have witnessed or committed racial microaggressions, and gain strategies to interrupt them.” Similarly, Teaching Tolerance offers free resources to help “educators grow their racial competence” and programs that “emphasize social justice and anti-bias.”
We must break the perception that every disparity that exists between groups (e.g., race) is due to a negative association with those groups (e.g., racism), as opposed to a factor that transcends them (e.g., family structure). The dearth of student-outcome data parsed by family structure makes it much easier to come to erroneous, race-focused conclusions. It also blocks opportunities to implement different types of interventions that could improve life outcomes for the next generation. For example, understanding the role of family structure could lead more schools to teach middle-school and high school students the success sequence—the series of life decisions (education, work, marriage, and only then children) that has led 97 percent of individuals who follow it to achieve economic success, and often to break an intergenerational cycle of poverty within their families.
In my own research into the role that family structure plays in educational outcomes, I discovered Chester Finn’s simple analysis of the limited leverage of schools: “Formal education occupies a surprisingly slender portion of our children’s lives. The youngster who faithfully attends class six hours a day, 180 days a year, from kindergarten through twelfth grade, will, at the age of eighteen, have spent just 9 percent of his hours on earth under the school roof. The other 91 percent is spent elsewhere.” The quality of the “elsewhere” environment is heavily determined by the structure and stability of that child’s family.
If we truly want to improve outcomes for children, we must have the moral courage to measure student-achievement outcomes by family structure as routinely as we now do by race, class, and gender. We must create a more complete picture to understand the forces affecting student achievement. More important, we must expand solutions and interventions to assist young people in finding pathways to success, especially in vulnerable communities—and help people understand that they have power in their individual choices, and that their own decisions shape their destiny, despite structural barriers associated with race, class, and poverty. Educators should explicitly communicate to children of all races the importance of finishing one’s education, getting a job, and forging a strong and stable family life. And a strong and stable family life usually entails marriage before children.
After I encountered the Who’s Your Daddy? truck in the Bronx three years ago, I was forced to confront my own beliefs about the factors that drive the progress we have made (or failed to make) in educational outcomes. Why have some groups of children consistently succeeded, while others continue to struggle? In answering that question, I have found that the categories of race, class, and gender generally do not tell the story, and that a deeper analysis is necessary to get to the truth.
Photo: monkeybusinessimages/iStock