
White progressives in America, as in Britain, avoid diverse neighborhoods and are more likely to leave diverse places than white conservatives. In effect, they don’t practice what they preach. These are the findings from large-scale quantitative research in the United States and Britain, recently published in my academic article, “White flight from immigration?: Attitudes to diversity and white residential choice.”
Diversity is a core value for white progressives in America and other Western countries. Over 60 percent of them support increasing immigration. As the Manhattan Institute’s Zach Goldberg shows, they are the only major part of the population to feel warmer toward other racial groups than toward their own: they rate whites as more lazy and violent, and less intelligent, than blacks. Among white progressives, 87 percent say that having an “increasing number of people of many different races, ethnic groups and nationalities” makes the U.S. a better place to live, while virtually none says that it makes the country worse.
Finally, a reason to check your email.
Sign up for our free newsletter today.
You would think that aversion to one’s racial group would prompt white progressives to flee disproportionately white areas for more diverse ones. Surveys do show that white progressives are more likely than white conservatives to indicate that they want to live in diverse places. Studies that present Americans with showcards of stylized houses as a proxy for race —some colored white, some black, with the proportion of the latter varied—find that those with progressive racial attitudes say that they prefer more diverse places than conservatives. These findings have been replicated in Britain and the Netherlands.
But when the rubber hits the road, white liberal attitudes don’t translate into behavior.
Getting a handle on actual migration is tricky. It requires a large survey because most people don’t move during a given year. Ideally, we need to track people over time, which demands repeated surveys of the same individuals. Finally, we must track both demographic factors, such as ethnicity and income, and political ones, such as voting or attitudes to immigration and diversity. Longitudinal surveys of this kind exist in Britain, but not in America. My strategy was therefore first to test my arguments with British data and then turn—for the U.S. study—to geotagged Twitter data from pro- and anti-Donald Trump individuals, as well as surveys that ask people for their past and present ZIP codes.
Results from Britain’s census confirm what we already know: minority people move toward areas of greater diversity than whites. My study is based on a massive representative census sample of 123,000 intercensal movers, and it controls for a wide range of material factors, including education, income, age, marital status, distance of move, and living in a mixed-ethnicity household. It also accounts for the affluence and population density of origin and destination neighborhoods. For data security reasons, I had to divide wards (averaging about 6,000 people) into five groups, each containing a fifth of the country’s minority population.
Figure 1, based on a 1 percent linked sample of the census of England and Wales, shows that, among people moving from the most diverse quintile of wards (averaging 66 percent minority), both whites and minorities move away from diversity—by necessity, because their only choice is similar or lower levels of diversity. However, the average white British person moves to an area fully three quintiles less diverse (averaging 13 percent minorities), while the typical minority moves to a neighborhood one to two quintiles less diverse (averaging between 27 percent and 43 percent minority). This ethnic difference holds regardless of where people start from. Thus, in the most homogeneous wards (averaging 2 percent minorities), everyone moves to more diverse places, but minorities move to more diverse areas than white Britons.
Figure 1
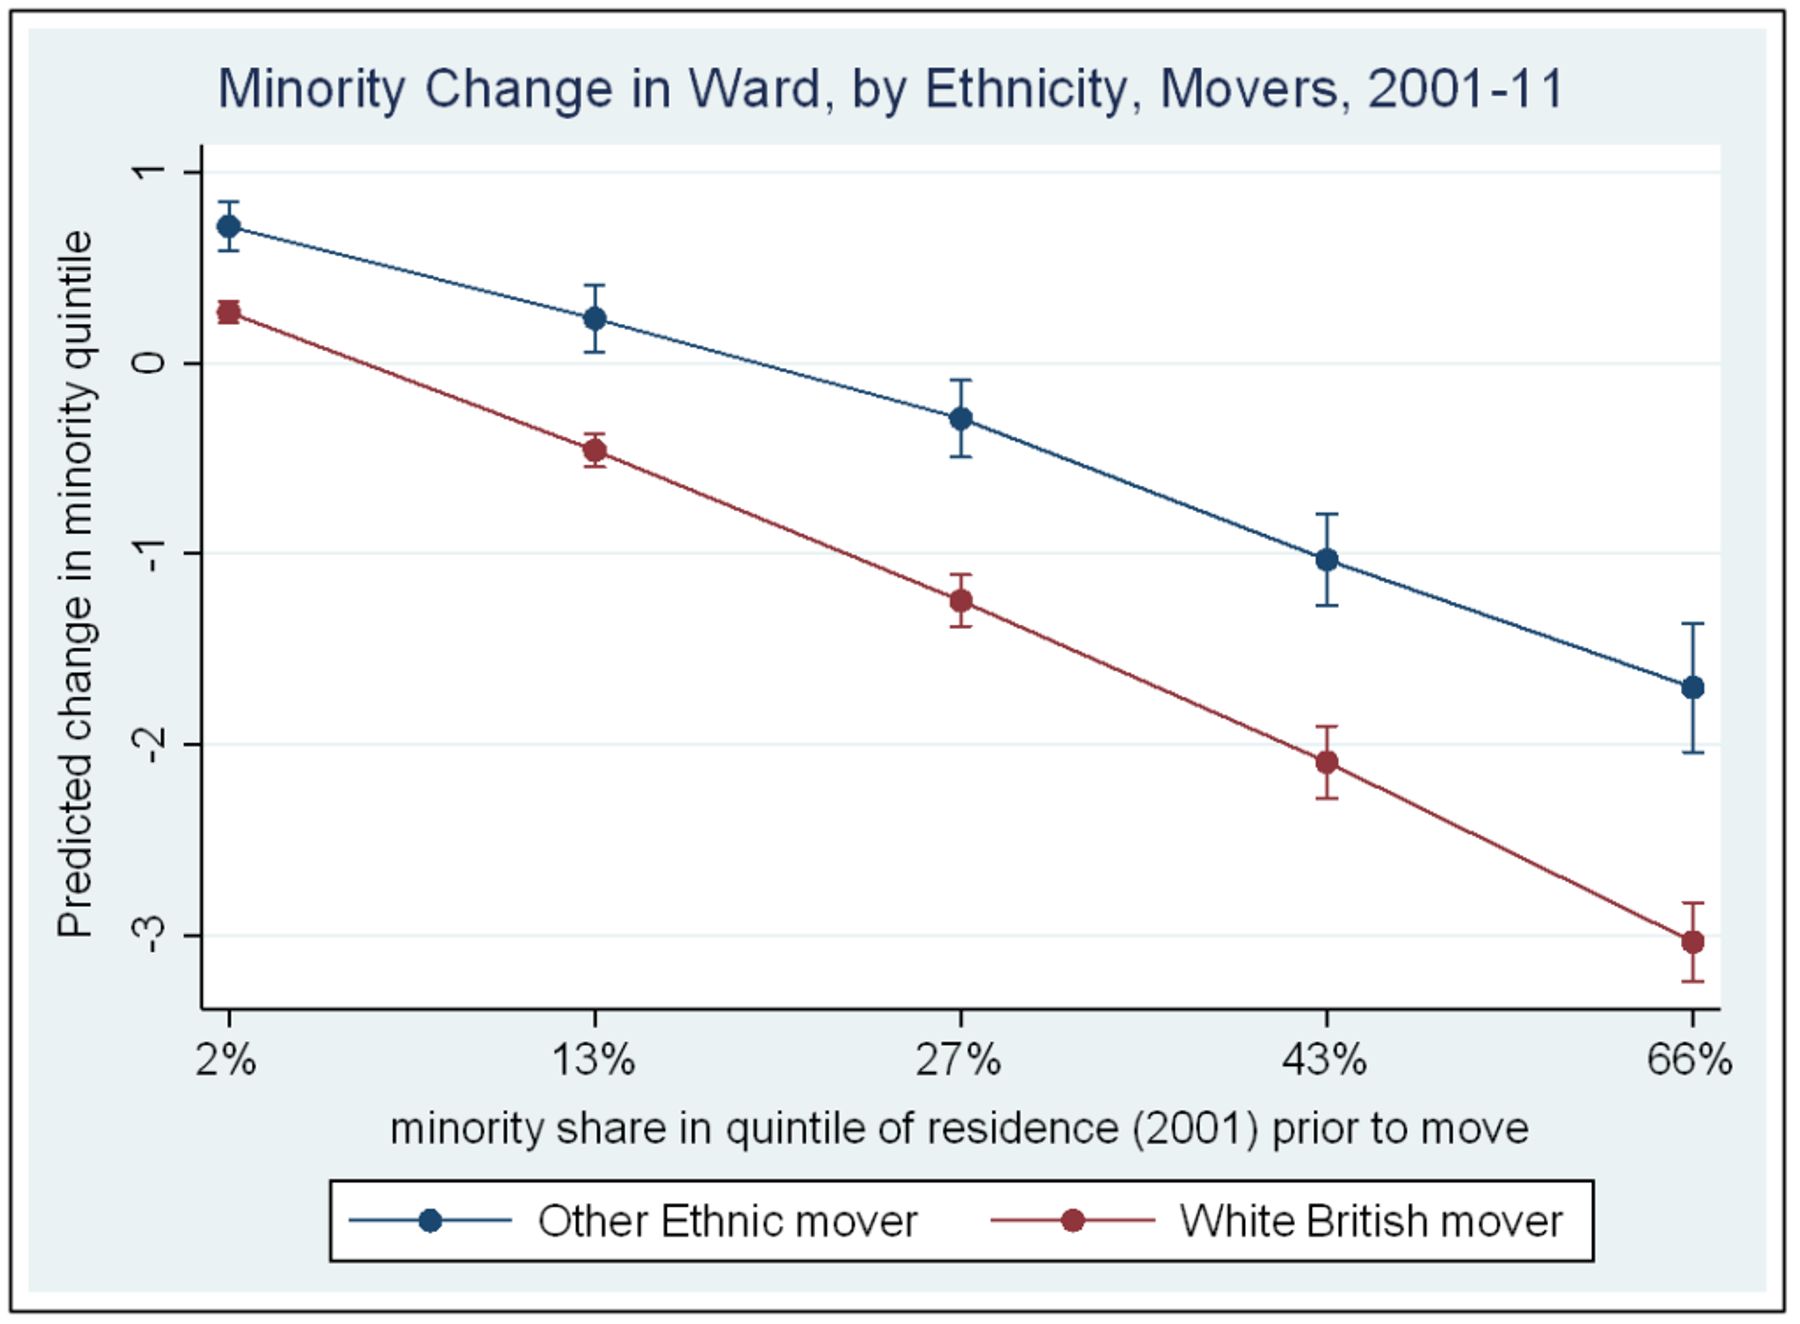
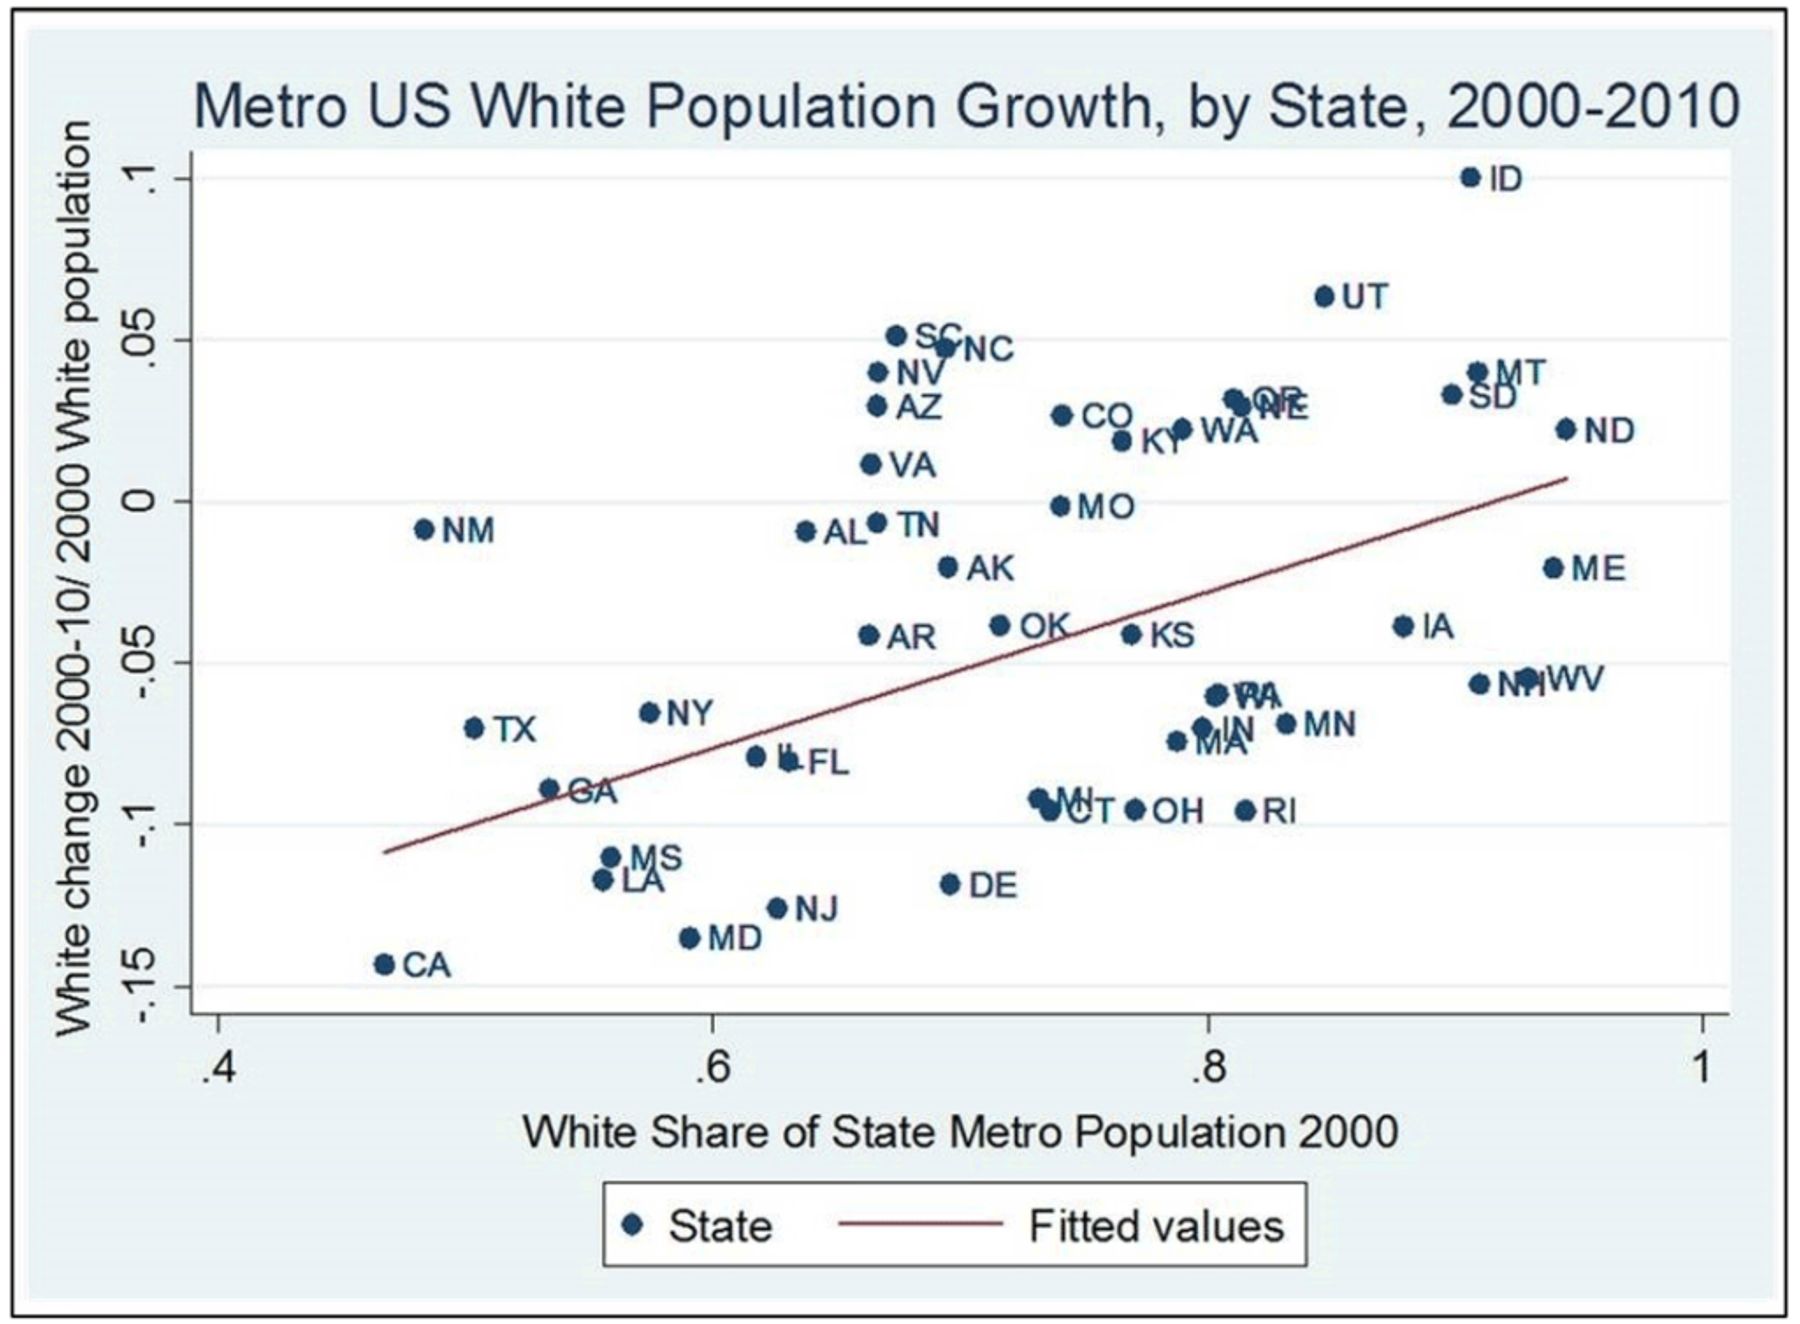
The ethnic differences in Figure 1 could simply reflect minority preferences rather than white ones, but two pieces of evidence suggest that white preferences really matter. First, showcard studies consistently find that whites prefer their neighborhoods to have a higher share of their own group than black, Hispanic, or Asian respondents do. Second, whiter neighborhoods, cities, and states tend to see absolute white population growth or at least less decline compared with more diverse places. While the white percentage in a place is affected by minority trends, the absolute numbers of whites should be relatively independent. A metro area like Nashville, for instance, might experience falling white population share due to large-scale Hispanic and Asian growth, even as its white population increases in absolute terms. However, many diverse metros resemble Los Angeles or Houston, with white populations declining in both percentage terms, due to minority growth, and in absolute numbers. The latter is an important indicator of white mobility, independent of minority patterns.
With this in mind, Figure 2 shows that, in the 2000s, metro areas in whiter states such as Idaho or Utah (think Boise or Salt Lake City) experienced white population growth, while those in the most diverse states such as California and Texas (for example, Los Angeles or Houston) saw significant white population decline. While one relatively diverse state, New Mexico, and some moderately diverse ones, such as Nevada and South Carolina, retained metropolitan white population, the general pattern has been for more rapid absolute white population decline in metro areas in diverse states. The same holds at the local level in both Britain and the U.S., apart from a small number of gentrifying neighborhoods in high-income cities such as London or New York.
Figure 2
I’ve established that whites move to whiter places than minorities do. But do white conservatives and liberals differ in the racial composition of their migration destinations? The English census asks a question about whether someone identifies as English or British. Among ethnic majority (White Britons) in England, other studies show that English identifiers tend to have a more “ethnic” sense of national identity and are more likely to support Brexit and want less immigration. Yet the census data from Figure 1, which shows a major ethnic difference in where people move, finds no significant difference between white English and British identifiers across more than 120,000 people who moved between 2001 and 2011.
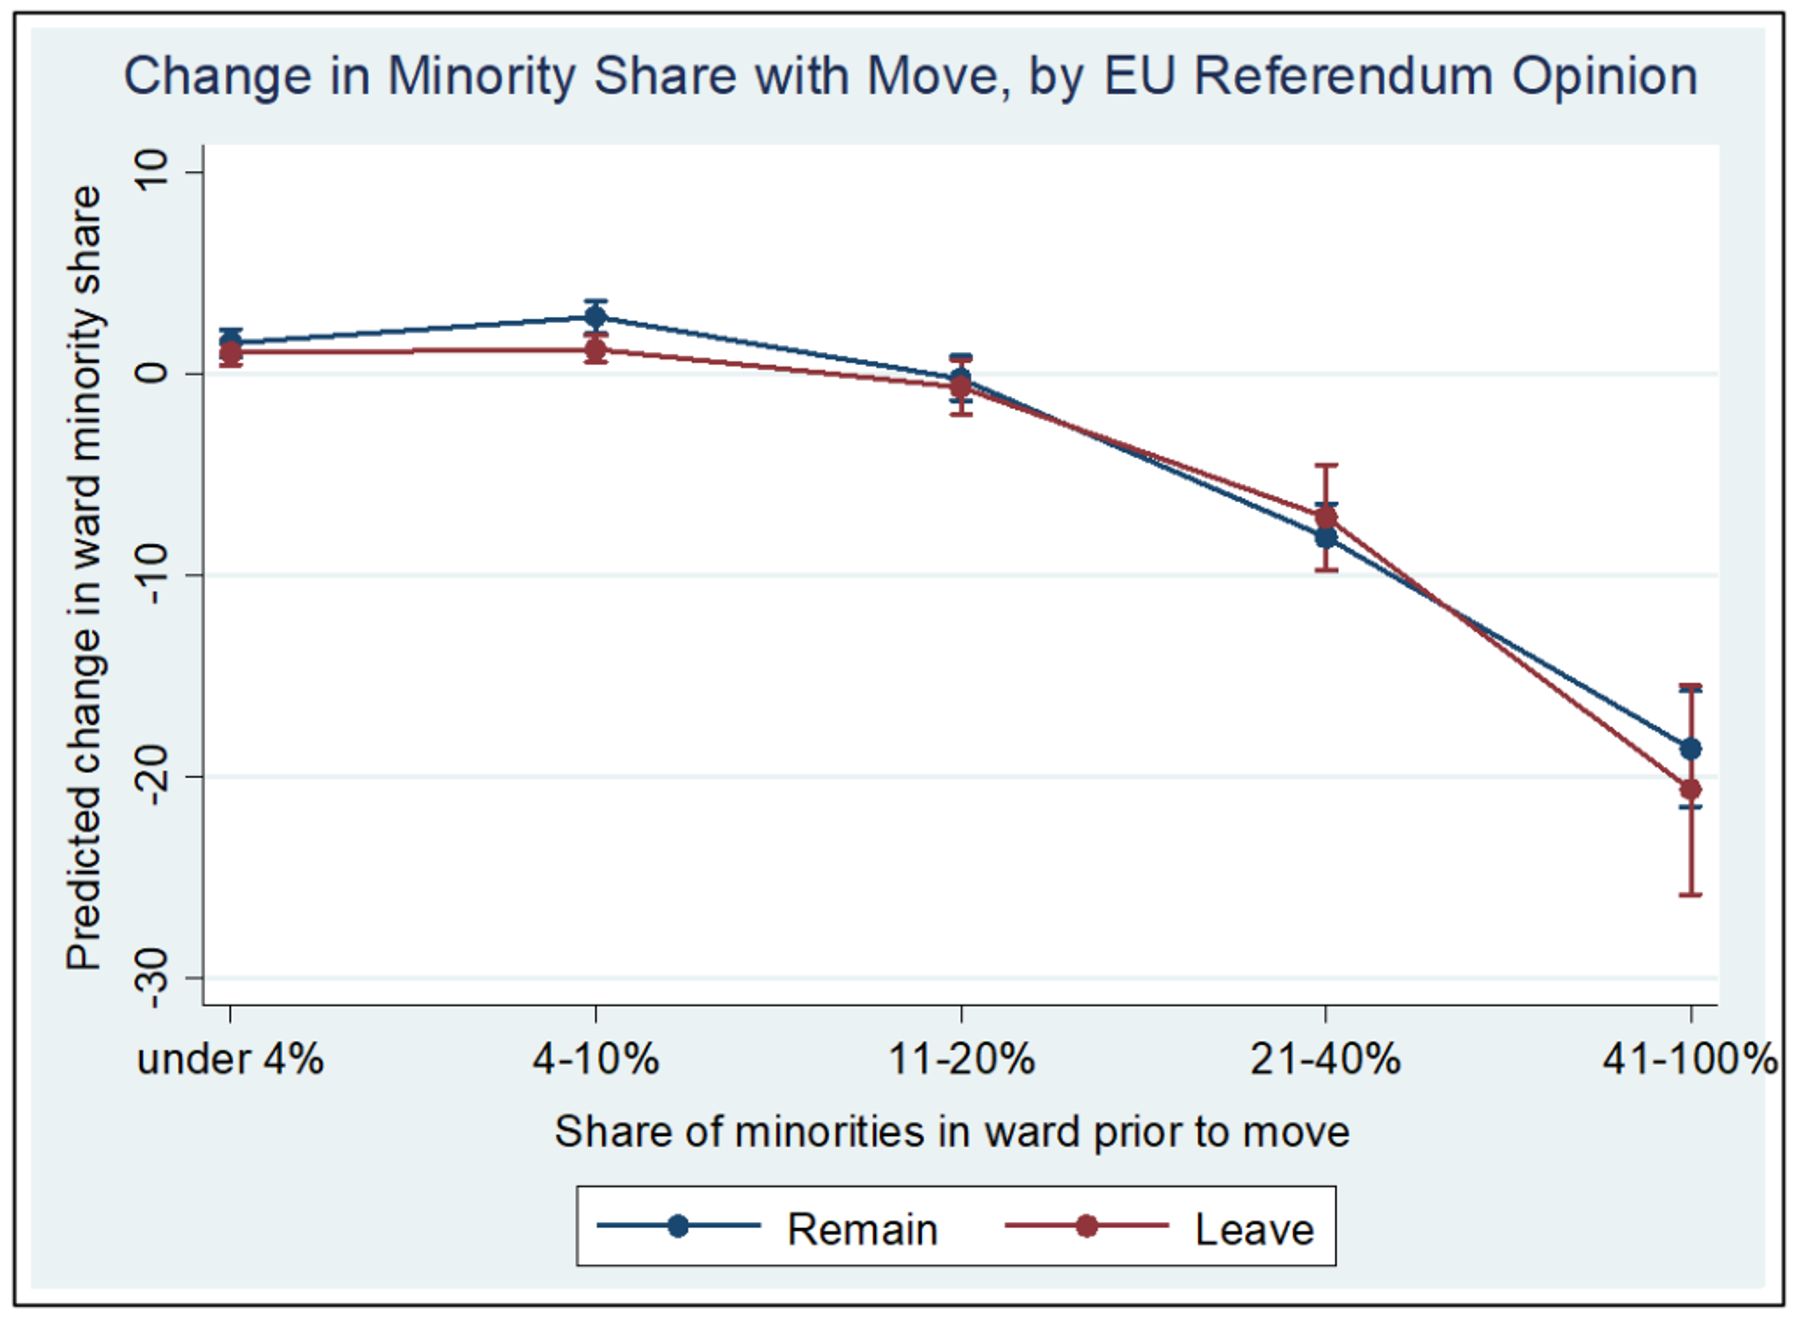
The Brexit question is a purer measure of opposition to diversity than English vs. British identity since opposition to immigration was by far the most important predicter of whether a person voted to leave the European Union. Figure 3 makes use of the 40,000-strong Understanding Society survey, which tracks the same individuals each year. It again controls for standard drivers of neighborhood choice, such as wealth, education, age, and marital status, as well as the population density and deprivation level of origin and destination wards. Notice how the red and blue lines overlap, whereas they are widely spaced in Figure 1. This shows that ethnicity matters but ideology doesn’t. Whether we look at Brexit support (as shown in Figure 3), left-versus-right voting, or support for the populist U.K. Independence Party or British National Party, white liberals and conservatives choose similarly diverse areas to move to.
Figure 3
The U.S. is somewhat trickier to study because it lacks longitudinal large-scale survey data with the right questions. I therefore collected a sample of 142 million Trump-related tweets between March and November 2016. Only a 1 percent subset had geotagging turned on, and of these only a small proportion moved during this period (residence is determined by matching morning and evening location). Sentiment analysis helped me identify strong pro- and anti-Trump accounts, which resulted in a sample of just over 6,000. These were then hand-coded to assign approximate age, gender, and race.
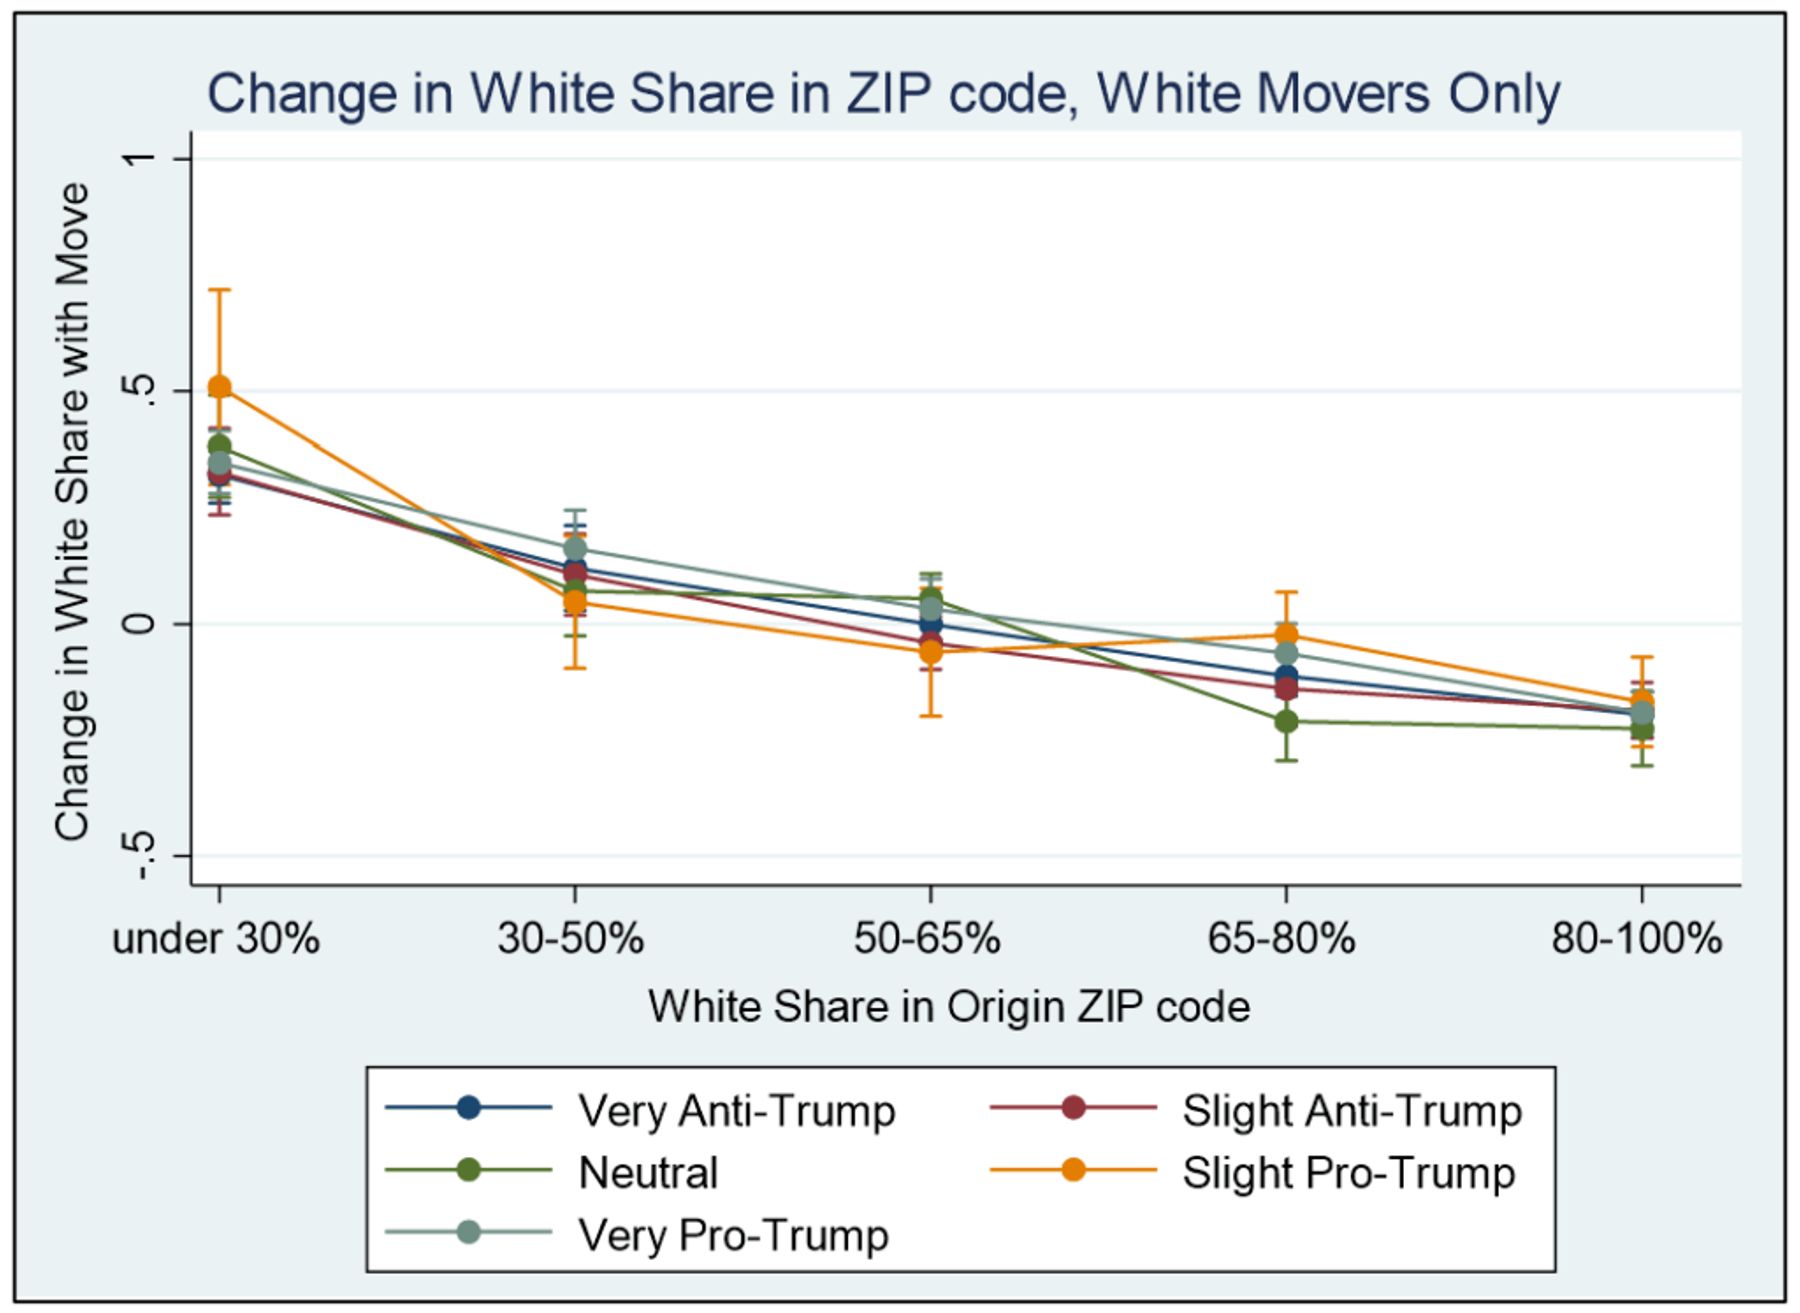
As in Britain, I found that whites tended to move to whiter neighborhoods than minorities. But did white Trump and anti-Trump Americans behave like British Brexit and Remain voters? Yes. The results of this analysis appear in Figure 4 and reinforce the British findings—namely, whites who strongly opposed Trump moved to places that were just as white as whites who strongly supported him. While the downward-sloping line shows that whites moving from diverse places chose less diverse destinations—as we would expect, given that those in diverse areas can only move to less diverse ones—there is no significant difference between the colored lines representing degrees of pro- and anti-Trump sentiment. The overlapping lines resemble the story in Figure 3.
Figure 4
A skeptic might say that people voted for Trump for many reasons besides their view of diversity, though the data are clear that views on immigration and diversity vary enormously between Republicans and Democrats. So I ran a survey of about 600 individuals, asking them for their current and previous ZIP codes to assess moving. The survey also asked about immigration attitudes, as well as 2016 vote and warmth toward Trump on a zero-to-100-degree thermometer.
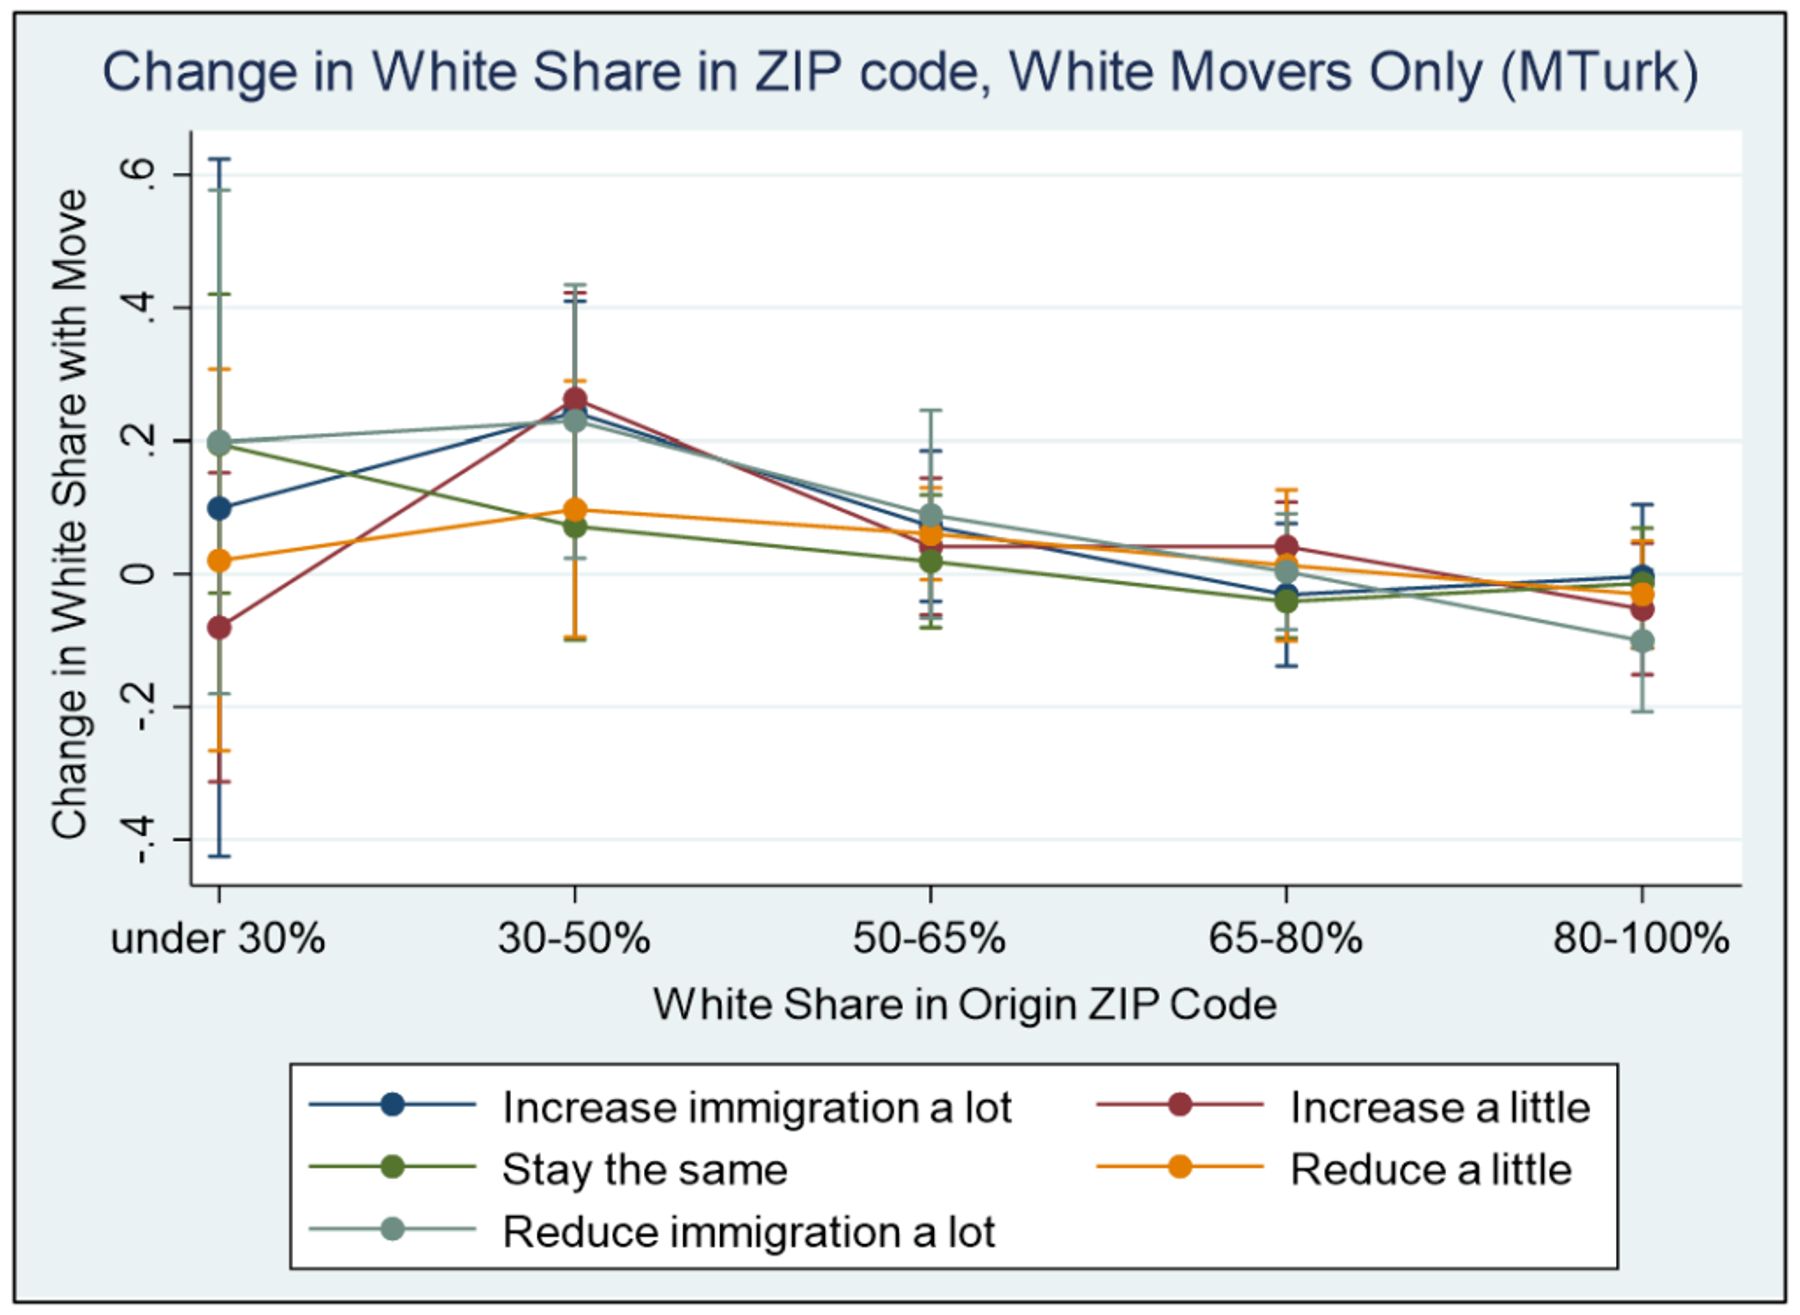
The results are identical to the American Twitter and British longitudinal survey analyses. White Republicans and Democrats, or pro- and anti-Trump supporters, don’t differ when it comes to the racial composition of their destination. Figure 5 shows that whites who want immigration reduced a lot move to places that are just as diverse as those who want it increased. While the smaller sample size (especially the small numbers of whites from highly diverse areas) is less reliable, the pattern remains the same. The tightness of the lines reinforces the finding that whites who support a national politics of diversity move away from diversity at the same rate as conservative whites who oppose national diversification through immigration.
Figure 5
Thus far, the evidence shows that white liberals and conservatives have the same domestic migration patterns when controlling for education, age, income, marital status, urbanity, and other factors. Yet I’ve only been comparing movers, assessing white avoidance rather than white “flight.” That is, looking only at whether new white residents avoid diverse areas, rather than considering all people, comparing movers with stayers, to assess if certain kinds of whites are more likely to leave diverse places than others.
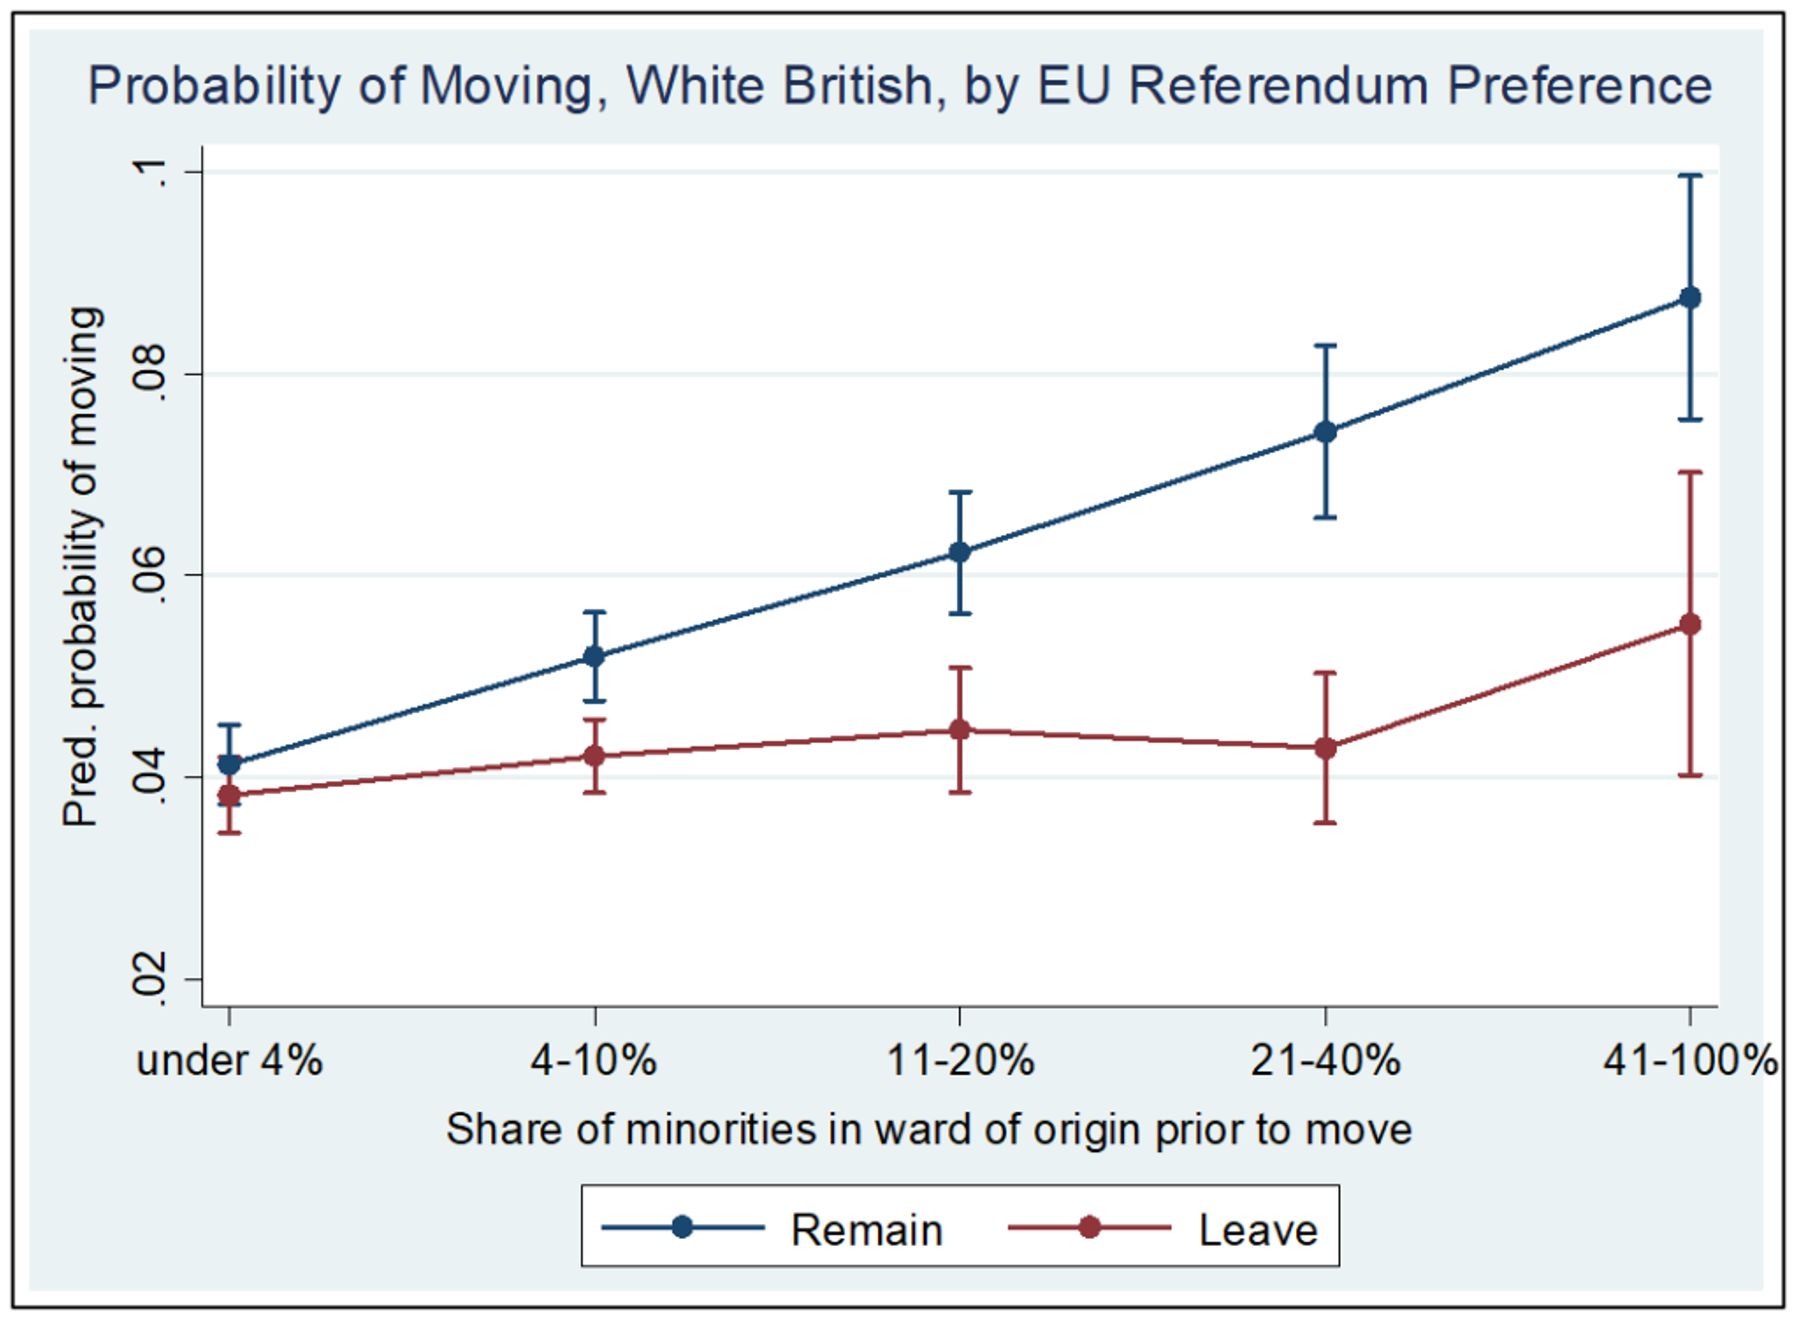
One could plausibly make the claim that, when you bring flight into the picture, white liberals are more likely to leave diversity than white conservatives. The Understanding Society data in Britain shows that white British voters who want to stay in the European Union are a few points less likely than their Brexit counterparts to say that they want to move. But as Figure 6 shows, white Remain voters are more likely actually to leave diverse places than white Brexit voters, after controlling for numerous sociodemographic factors. Why?
A clue lies in the generally lower rate of white Brexit outmigration across all types of neighborhood. In effect, movers are more liberal than stayers. Diverse urban neighborhoods tend to have higher turnover. Since white conservatives are more constant in their attachments than white liberals, their propensity to leave differs more from white liberals in diverse, transient places. The net result, amazingly, is that white liberals are more likely to “flee” diverse places than white conservatives. A Swedish study likewise found that in diverse neighborhoods, whites who stayed expressed more negative attitudes toward immigrants than whites who left.
Figure 6
The bottom line: white liberals may vote for diversity with their ballots, but their feet tell a different story.
Photo by John Lamparski/Getty Images