
Congress assigned the Federal Reserve three monetary objectives: “maximum employment, stable prices, and moderate long-term interest rates.” Since lawmakers declined to define any of these terms, convention leaves the Fed to interpret them as it pleases. The interpretation of these goals has had profound implications for how the Fed runs monetary policy—especially vital at a time of high inflation stoked by the central bank’s mistakes.
For decades, the Fed successfully employed a monetary framework that recognized the inherent uncertainty in identifying and managing stable prices. But in 2012, the Fed dramatically changed its approach to one that targets a precise rate of inflation.
Finally, a reason to check your email.
Sign up for our free newsletter today.
However, the general price level isn’t directly observable, so it must be constructed. Each step in the construction requires a methodological choice by human researchers, unavoidably introducing subjectivity. Consequently, measuring inflation becomes such a tangled mess that achieving the precision needed to target a specific amount of inflation is hopeless. Different measures of inflation often say more about what researchers and policymakers choose to measure than about the prices experienced by citizens. Nobody knows what inflation “really” is.
It might appear obvious that we can’t precisely target what we can’t precisely measure, but that hasn’t stopped the Fed from trying. In seeking to achieve increases of inflation by only a half-point, the Fed has repeatedly pumped asset prices, masking structural deficiencies in the economy and causing capital misallocation. Inflated asset prices have incentivized Congress and voters to neglect nonmonetary policies that would drive broader prosperity—from fundamental tax reform to curbing the regulatory state to addressing the ravages of globalization on industrial plants. Such policies inevitably face lobbyist opposition, while letting the Fed blow bubbles does not.
More recently, inflation targeting has contributed to the current inflationary disaster, as the Fed sought half-point inflation overshoots to compensate for earlier half-point undershoots and allowed inflation to metastasize. To deliver superior outcomes, the Fed should revert to its old framework.
Two broad approaches exist to the Fed’s legislative mandate for stable prices. The first pursues just that: price stability—the avoidance of large swings in the general price level. This regime aims for low and stable inflation but is rather vague about what that means. One might consider inflation rates of, say, zero or 3 percent to satisfy price stability, though they might be at the extreme borders of the acceptable zone.
The second method, inflation targeting, pursues a specific rate of change of the price level. Today, the Fed targets 2 percent inflation and seeks to adjust policy to attain it, subject to its employment and interest-rate mandates. While many inflation measures are available, the Fed targets one particular form of consumer inflation: the price index for personal consumption expenditures (PCE).
These two approaches stand in tension. Consider former Fed chairman Alan Greenspan’s 2006 statement that “by price stability, however, I do not refer to a single number,” for “it has become increasingly difficult to pin down the notion of what constitutes a stable general price level. . . . [A] specific numerical inflation target would represent an unhelpful and false precision.” And former chairman Paul Volcker described price stability as “a situation in which expectations of generally rising (or falling) prices over a considerable period are not a pervasive influence on economic and financial behavior,” adding that “ ‘real’ and ‘nominal’ values are substantially the same” over a long enough time horizon. Volcker wanted inflation not to interfere with the ordinary operation of business in the economy, so that households and firms would not notice it.
Events spurred the central bank to change policy regimes. In 2012, Fed chairman Ben Bernanke introduced a formal inflation target for the first time. Following the global financial crisis of 2008, the ghost of the Great Depression haunted the Fed, and the central bank struggled to keep inflation above levels that threatened a debt-deflation spiral. The Fed adopted a specific inflation target, believing that this would add credibility to its efforts to lift inflation. The Fed believed that forms of forward guidance could produce better economic outcomes by anchoring inflation expectations and manipulating the term structure of interest rates.
In 2020, the Fed went further down this road when it introduced a framework called “flexible average inflation targeting.” Measured PCE inflation had run for years closer to 1.5 percent than to the 2 percent target. The Fed decided that a period of inflation closer to 2.5 percent was welcome, in order to compensate for past shortfalls by achieving modest overshoots.
The abandonment of price stability for inflation targeting was a product of circumstance—particularly the post-2008 fear of relapsing into a Depression-like deflation. Yet, while economic exigencies have changed since 2012, the Fed has stuck with inflation targeting.
The general price level and its rate of change (“inflation”) are abstractions; they don’t tangibly exist in our world. A pound of sugar exists and can be touched, measured, and priced. A generalized price level does not and cannot. We can speak only of “measured” inflation—that is, the price-level increase as the various statistical agencies report it.
The statistical agencies do excellent work, but the problem of measuring a general price level is so squishy as to pose an insurmountable obstacle to inflation targeting. Consider four key questions that one must answer when measuring inflation. Different answers can result not only in different measurements but in a different concept being measured.
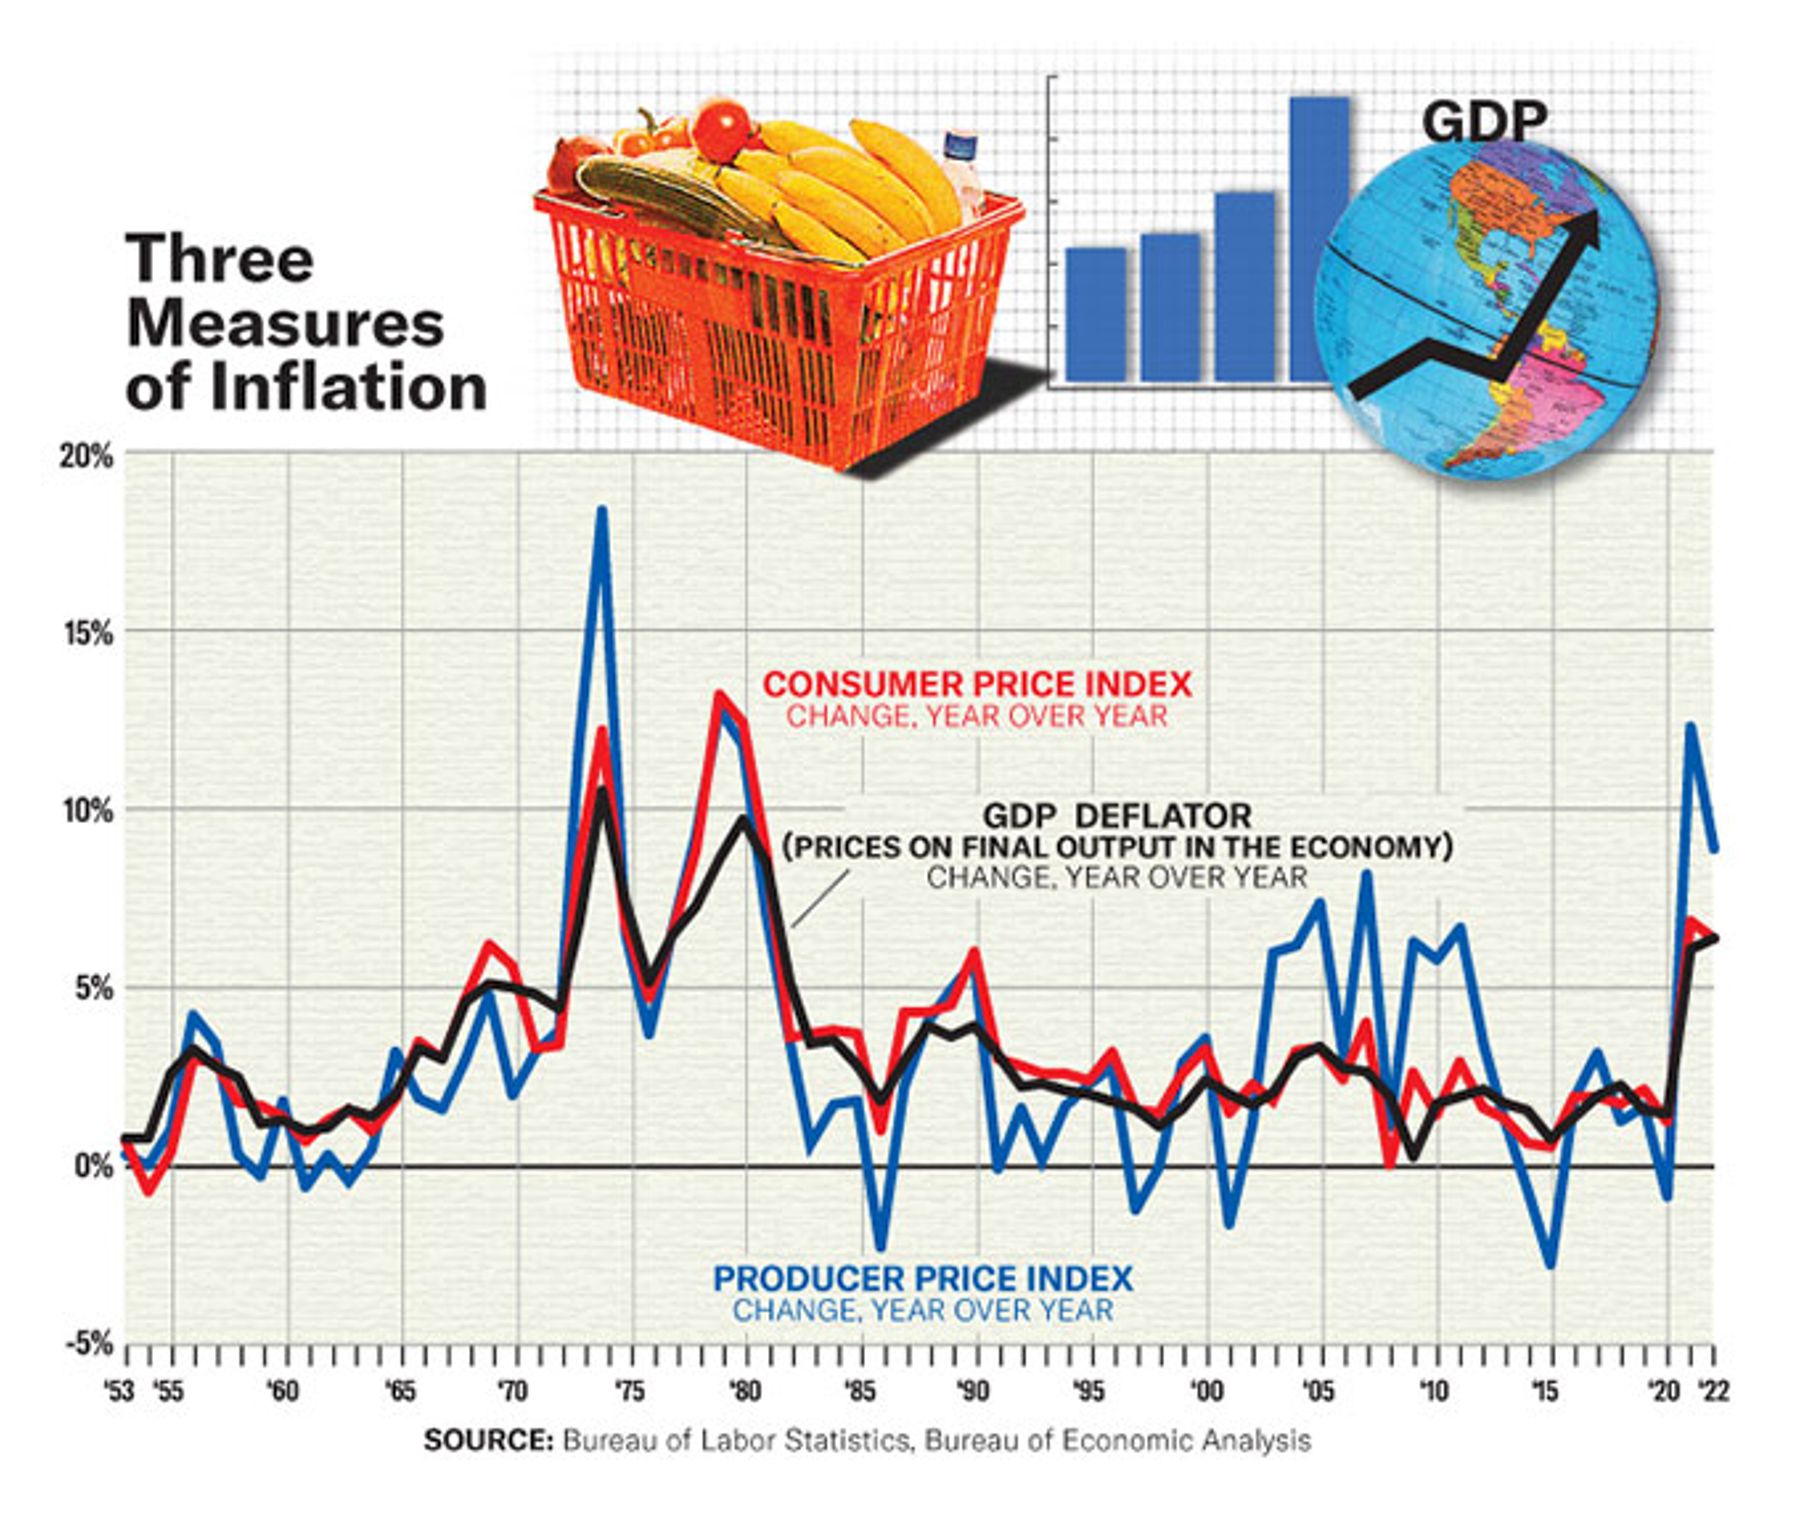
Which prices should be measured? The options include consumer prices on goods and services that households buy; producer prices on primary and intermediate goods and services that firms sell; and the prices on final output in the economy as a whole, called a GDP deflator. Double-digit differences can exist between these various measures.
The Fed has chosen to focus exclusively on consumer prices, which is very likely the right decision. Two high-profile indexes track them: the Bureau of Labor Statistics (BLS) Consumer Price Index (CPI) and the Bureau of Economic Analysis PCE price index. The two concepts usually differ by about a half a percentage point of inflation per year, though they can easily differ by a full point or more. Until 2000, the Fed focused mostly on CPI.
The choice between indexes has major implications. While PCE, the Fed’s chosen index, seeks to measure all expenditures made on behalf of consumers, CPI tries to measure what consumers themselves spend. This matters particularly for health-care expenditures, which are often paid for by third parties and which have become ever-larger slices of the economic pie. Health care has just an 8 percent weight in the CPI—but a 20 percent weight in the PCE. Government-guided Medicare and Medicaid pricing exert substantial influence on the PCE but are excluded from the CPI. If the Fed’s means of achieving stable prices is to balance supply and demand, it’s unwise to interpret prices set by government as indicative of a supply–demand imbalance. To offset the drag on measured inflation exerted by the Affordable Care Act, the Fed spent much of the last decade with interest rates at zero because Congress changed Medicare reimbursement rules, at the expense of significant capital misallocation.
The Fed also focuses on subcomponents of inflation. Most commonly, it highlights “core inflation,” which excludes volatile food and energy costs. While the Fed purports to target overall inflation, it usually points to core inflation as predictive of where overall inflation will head. In practice, the distinction is usually irrelevant since the Fed acknowledges its inability to control energy prices and its unwillingness to cause job losses for the sake of bringing down oil prices after a spike. More recently, the Fed has drawn attention to so-called supercore measures of inflation, which can further exclude housing costs and car prices.
Yet the modern Fed’s focus at any given moment is often an exercise in data mining to reach a desired result. In 2021, as the White House, monetary policy officials, and friendly journalists insisted that rapidly materializing price spikes were “transitory” artifacts of supply-chain snags, they had no shortage of ways to slice data to suit their policy objectives.
How do inflation metrics account for new products or quality improvements? This question is perhaps the hardest to answer. When a new product gets invented—say, a smartphone—no measure of its price yet exists. How, then, can we compare its price over the years? We might wait a few years to include it in the index, because by then we will have some history. But in doing so, we’ve conceded that we are mismeasuring inflation while excluding the new product. And new products are being invented and adopted faster than ever.
Innovations render long-term inflation comparisons exceedingly difficult. The basket of goods that consumers buy changes radically. How can we compare the current general price level with that of the 1990s or 1950s? Many of the goods and services that Americans buy didn’t exist back then. (Incidentally, this makes most conversations about quantifying increases in “real incomes” over long periods quite difficult.)
Another problem: economists have long accepted that, holding prices constant, a higher-quality product means a lower effective price (using the term “hedonic adjustment” to describe quality improvements). However, quantifying quality improvements can be fraught. For example, how to value an improvement in medicine that results in fewer side effects or deaths than the old treatment? What about “planned obsolescence” in electronics, which manufacturers use to accelerate the selling cycle? The BLS valiantly attempts to measure these things, but precision is hopeless.
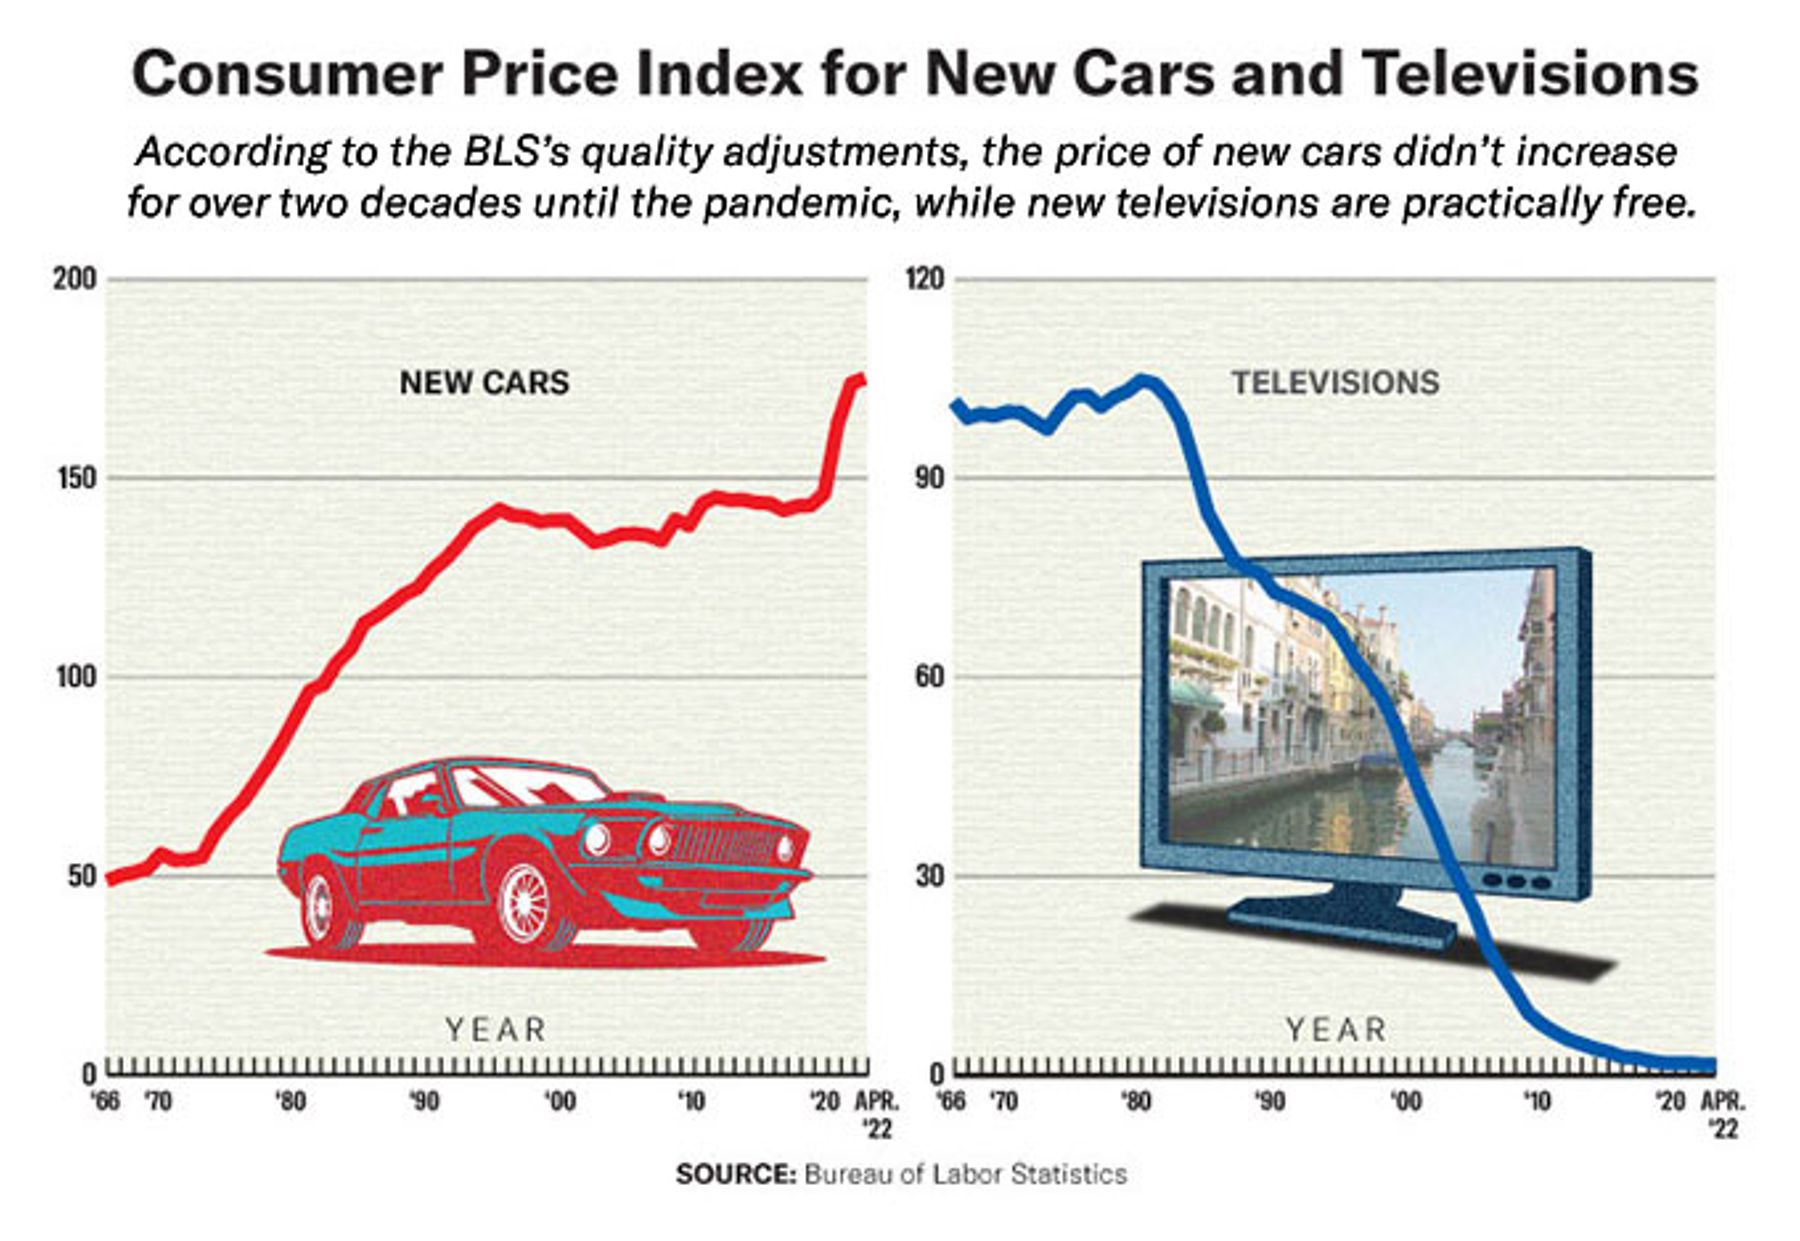
Consider the CPI series for televisions. According to the BLS, televisions cost little more than $0.01 in 1982 dollars, the base year. While it’s true that a television from 1982 would, today, likely cost a small fraction of its original price, few people buy a TV manufactured during Ronald Reagan’s first term. And nobody buying a television today celebrates that TVs, according to the BLS, are almost free, despite the CPI telling them so (try telling people in a checkout line at a big-box store that they should be grateful for their free TVs).
How can one measure in price the development of high-definition TVs, 4K TVs, curved screens, three-dimensional screens, flatscreens, touchscreens, Internet-enabled TVs, surround sound, and more, relative to 1982-vintage televisions? The “true” quality-adjusted price for televisions could be far higher or lower than what the BLS reports; we simply have no way to know. “How much would a 1982 TV cost today?” is a useless question—nobody wants a 1982 TV. This is not to say that the BLS is doing it wrong—but just that the questions are impossible to answer satisfactorily.
Similarly, the BLS considered quality-adjusted new-car prices virtually unchanged from 1996 until the eve of the pandemic. It would be absurd not to recognize quality improvements, but recognizing them also seems to lead to absurdity. Because technological progress makes products better over time, the process of adjusting for quality introduces a significant long-term deflationary trend into the goods components of the index. If the Fed is targeting a particular overall inflation rate, this drag on overall inflation due to technology requires the central bank to compensate by trying to create more inflation elsewhere.
How should researchers handle housing? Shelter, the single largest expenditure for most households, constitutes more than one-third of CPI weight. The details of how shelter inflation is constructed affect inflation measurements significantly.
Here, too, metrics can miss on-the-ground reality. A typical household’s cost doesn’t change every month. Most households sign leases for a year at a time, meaning that the metrics are sluggish to adjust to rents paid on new market leases. Should we measure instantaneous market rents, or spread out an increase in rents over a year, knowing that, in any given month, only about a tenth of households experience higher prices? In practice, the BLS adopts the spread-it-out method, dividing the sample into smaller subsamples and asking for rent data every six months. As a result, shelter CPI will necessarily lag changes in the housing market, sometimes by over a year. There’s a logic to this, but also to the alternative.
Further, only about one-third of households rent. While homeowners pay mortgages or opportunity costs for owning a home, a house, unusually, is both an investment and a consumption good. To help resolve the ambiguity, the BLS imputes a measure of “owners’ equivalent rent” whose weight in the basket is calculated by asking homeowners: “If someone were to rent your home today, how much do you think it would rent for monthly, unfurnished and without utilities?” Households guess the answer to this question rather than refer to a transacted market price, meaning that it’s imprecise.
To be clear, housing expenditures must be included in any useful inflation calculation. But the current U.S. approach is by no means the only option. In earlier decades, the BLS directly included mortgage costs in the CPI. Some prominent economists argue that this methodological change alone can swing inflation rates by over 5 percentage points—more than double the Fed’s inflation target.
Abroad, Eurostat and the European Central Bank have opted to underweight shelter by excluding owner-occupied housing altogether and only counting rents, since the European national statistical agencies couldn’t agree on a common methodology. Any comparison between American and European inflation is therefore comparing apples and oranges, and the lack of consensus in Europe underlines the notion that measuring shelter involves a large degree of judgment. Some countries, like Sweden, still include mortgage interest, though the Riksbank in 2017 switched its target to an alternative measure of CPI that excludes mortgage costs.
Which technical details belong in the weighting methodology? These matters are uninteresting for people who are not economists or statisticians, but the choice of base period, the frequency of weight and basket adjustments, and methods of calculating averages can all have significant effects on indexes. For instance, when prices shift dramatically, consumers can rapidly change their consumption basket. Should inflation reflect the old basket, even though it’s not being consumed, or the new basket, even if it will ignore or down-weight the recent price changes? To consider another example, recent BLS research finds that calculating the Producer Price Index from geometric, rather than arithmetic, averaging would, if implemented, shift the final demand index level by more than 10 percent over the last six years.
Given measurement complications, the true rate of inflation remains wildly uncertain, sometimes leaving the Fed flying blind. Measurement error in inflation will, most of the time, dwarf observed deviations from a 2 percent target. The Fed spent most of the last decade fretting over inflation running closer to 1.5 percent than to 2 percent, as if it could credibly measure inflation precisely enough to identify a half-point gap.
Such concerns also miss the spirit of the central bank’s duties. As economist Martin Feldstein once said, “the man on the street doesn’t want to be concerned about small numbers or about ‘core’ inflation versus ‘regular’ inflation. He wants price stability; he wants the purchasing power of the money that he has to stay the same.” Most people can’t distinguish between 1 percent and 2 percent measured inflation: both seem like normal price stability. But they can tell the difference between price stability and high inflation. The Federal Reserve Act was written by legislators much closer to ordinary people than to economists. Did its authors really mean for the Fed to interpret “stable prices” as 2 percent annual rises in the PCE index?
That we cannot measure inflation with anything remotely like scientific accuracy renders it foolish to target so exact a level—or to react with large policy swings when measured inflation has modest misses. But if the pursuit of false precision reduces the quality of outcomes, it raises the Fed’s importance to the economy of both the U.S. and the world. Overreliance on the Fed as an engine of growth is an unfortunate result. Congress, for example, has less incentive to enact tough changes to the tax or regulatory system so long as the Fed inflates asset bubbles that mask an underlying loss of dynamism. This unfortunate dynamic has been justified over the last decade by saying that “the Fed is the only game in town” for generating growth.
The pursuit of precision has had more recent consequences, too. When the central bank introduced a “flexible average” inflation target in 2020, it became willing to overshoot its inflation target to compensate for past (measured) undershoots. Due to the undershoots of previous years, the Fed—shockingly—welcomed the initial phases of price instability in 2021, allowing inflation to take off. The result was CPI inflation of 9 percent, an extremely fast tightening cycle, and waves of financial instability.
A price-stability approach would have delivered superior outcomes. Policymakers could have shrugged off the difference between 1.5 percent and 2 percent measured PCE inflation, satisfied that both were largely consistent with stable prices. Yet those concerned with price stability would have sounded the alarm as CPI inflation crept up, from 3 percent to 5 percent in the spring of 2021. Instead, the Fed kept policy settings at the loosest in history—zero percent overnight rates and purchasing $120 billion per month of assets—for far longer, eventually driving the CPI to 9 percent.
To think that we can precisely measure inflation in backward-looking data and forecast it in the future is arrogant. To think that we can fine-tune policy to modulate inflation by half a percentage point is even more arrogant. Such small numbers are trivial relative to measurement error, and monetary policy instruments are blunt.
But while the Fed’s current approach isn’t sacrosanct, certain adjustments would prove counterproductive. Whether the Fed ought to raise the target is a perennial policy debate, with progressives such as Senator Elizabeth Warren advocating higher numbers. But policymakers would have a tough time convincing markets that such a change would occur only once. Were the Fed to raise its target now to avoid a rise in unemployment, markets would assume that such a step would be repeated and immediately price in significantly higher medium-term inflation. Routs in the Treasury and dollar markets would cause severe economic damage. Once broken, policy taboos cease to bind.
Would it be reasonable to change the target to an inflation “band”—say, from 1 percent to 3 percent? Similar issues would quickly emerge. Instead of debating half-point deviations from one level, we’d be debating them from two. The same issues regarding which prices to measure, and how to measure them, remain.
The best fix? Ditch the inflation target and the exclusive focus on PCE inflation, return to price stability, and focus on a broad array of price data. A single-minded focus on stable prices, like that expressed by Chairman Volcker while fighting the inflation of the 1970s, should meet with a warm reception in the markets. Though inflation has fallen somewhat through 2023, prices remain unstable, with the CPI having grown near 5 percent over the last year. A return to price stability would help reduce this number, not just for a month or two but durably. It would also lessen the risk of future bouts of inflation.
The experiment with inflation targeting has failed beyond its immediate goal of helping avoid a debt-deflation spiral in 2012. Heeding the subtleties of measurement, the Fed should remain humble about the limits of human understanding of inflation, rein in its pretenses of scientific accuracy, and aim squarely at attaining the more modest goal of price stability. We cannot precisely target what we cannot precisely measure.
Top Photo: Longtime Federal Reserve chairman Paul Volcker sought to stabilize prices during the devastating inflation of the 1970s. (JAMES K. W. ATHERTON/THE WASHINGTON POST/GETTY IMAGES)
