
The Federal Reserve’s preferred measure of inflation, the personal consumption expenditures price index (PCE), declined from a blistering-hot rate of 7 percent last year to a still-too-high rate of 3 percent in October. White House economists argue that the worst bout of inflation since the 1970s was due to pandemic-related supply shocks—conveniently absolving themselves of responsibility.
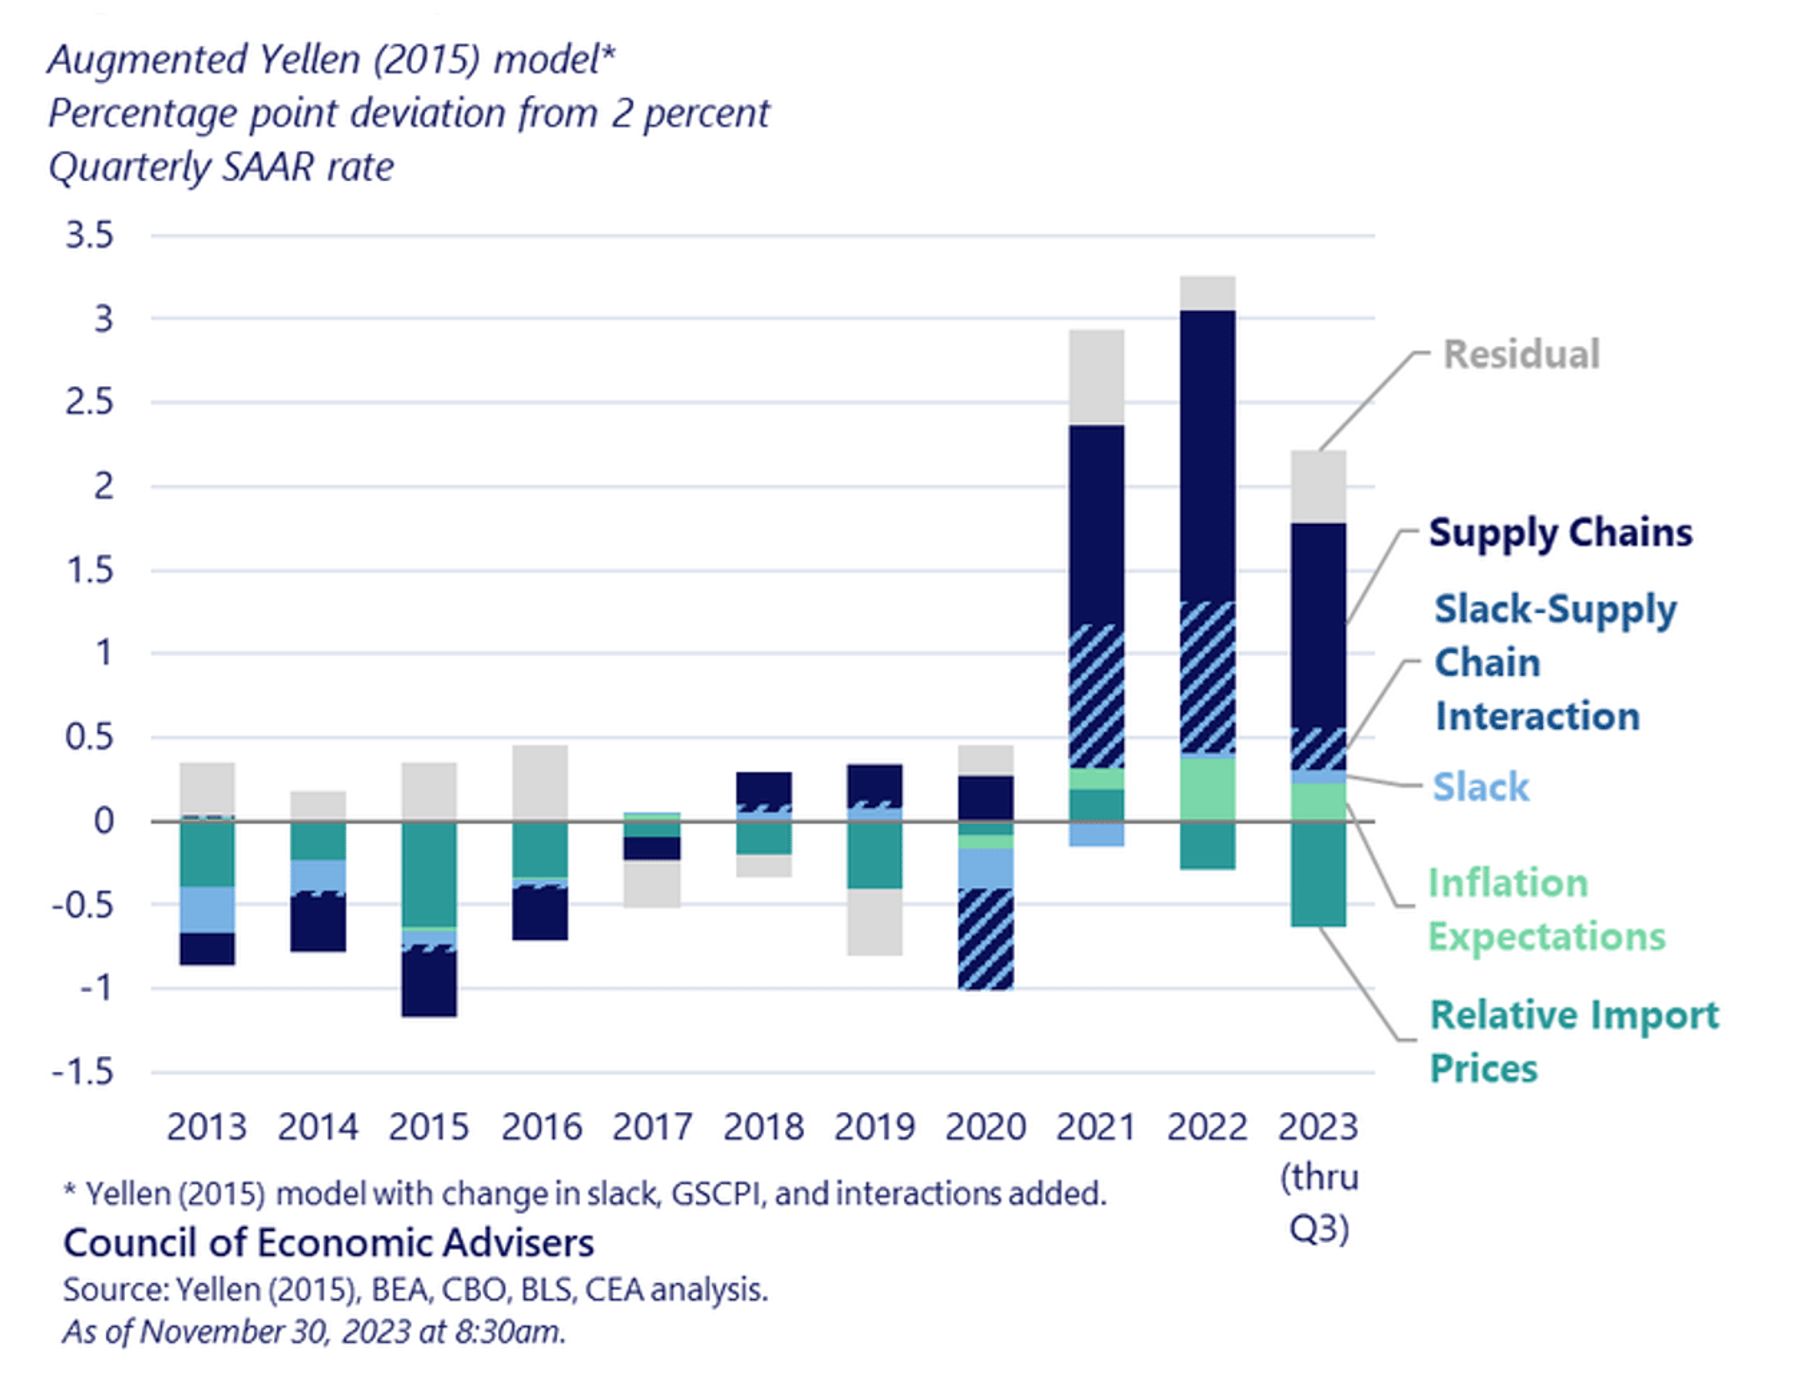
In a November 30 blog post, the White House’s Council of Economic Advisers (CEA) used a model that then-Federal Reserve chair Janet Yellen developed in 2015 to analyze the changes in inflation. The model found that excess demand—the result of a financial stimulus pushing the economy beyond its productive potential, or what CEA calls “slack”—was directly responsible for only a small fraction of the recent inflation spike. Instead, CEA attributed the high prices mostly to supply-chain disruptions, arguing that inflation has normalized as pandemic-era supply-chain snarls have resolved.
Finally, a reason to check your email.
Sign up for our free newsletter today.
CEA’s Decomposition of Excess Inflation
This analysis implicitly rejects so-called Philips Curve models of inflation, which posit a relationship between inflation and various measures of slack, such as the unemployment rate. The correlations between measures of slack and inflation have broken down or fluctuated over time, which critics use to dismiss Philips Curve models and argue that no meaningful relationship exists between the two variables. The Philips Curve’s failure is appealing to those who want to engage in large-scale fiscal spending because it justifies continued government stimulation of the economy.
The biggest problem with the CEA’s case is its narrow conception of labor-market slack, implied by its use of the unemployment rate alone as the indicator. Indeed, as Fed chair, Yellen emphasized that the unemployment rate, while one of the most useful individual measures, did not tell the whole story about the labor market. Yellen often argued that other data, such as labor-force nonparticipation and the number of people working part-time jobs, also were important indices of labor-market health. For Yellen as Fed chair, a low unemployment rate was insufficient reason to hike interest rates and tighten monetary policy because it didn’t capture other dimensions of labor-market slack.
Yellen went on to promote a tool known as the labor-market conditions index (LMCI), which takes a cluster of indicators and reduces them to a single number using a statistical technique called principal-components analysis. The LMCI not only includes unemployment but also job openings, hours worked, participation rates, and more. Yellen later abandoned the LMCI and instructed the Fed to stop using it. One memorable problem with the Fed’s initial LMCI framework related to its including a specific variable: job advertisements on Craigslist. When Craigslist hiked its fees, the number of job ads fell significantly. The LMCI incorrectly interpreted that as a loosening in the labor market.
Still, indicators such as LMCI are useful for assessing the overall state of the economy and can be adjusted to drop problematic indicators such as the Craigslist series. The Kansas City Federal Reserve Bank maintains an LMCI based on 24 variables that is significantly improved over the measure in use a decade ago.
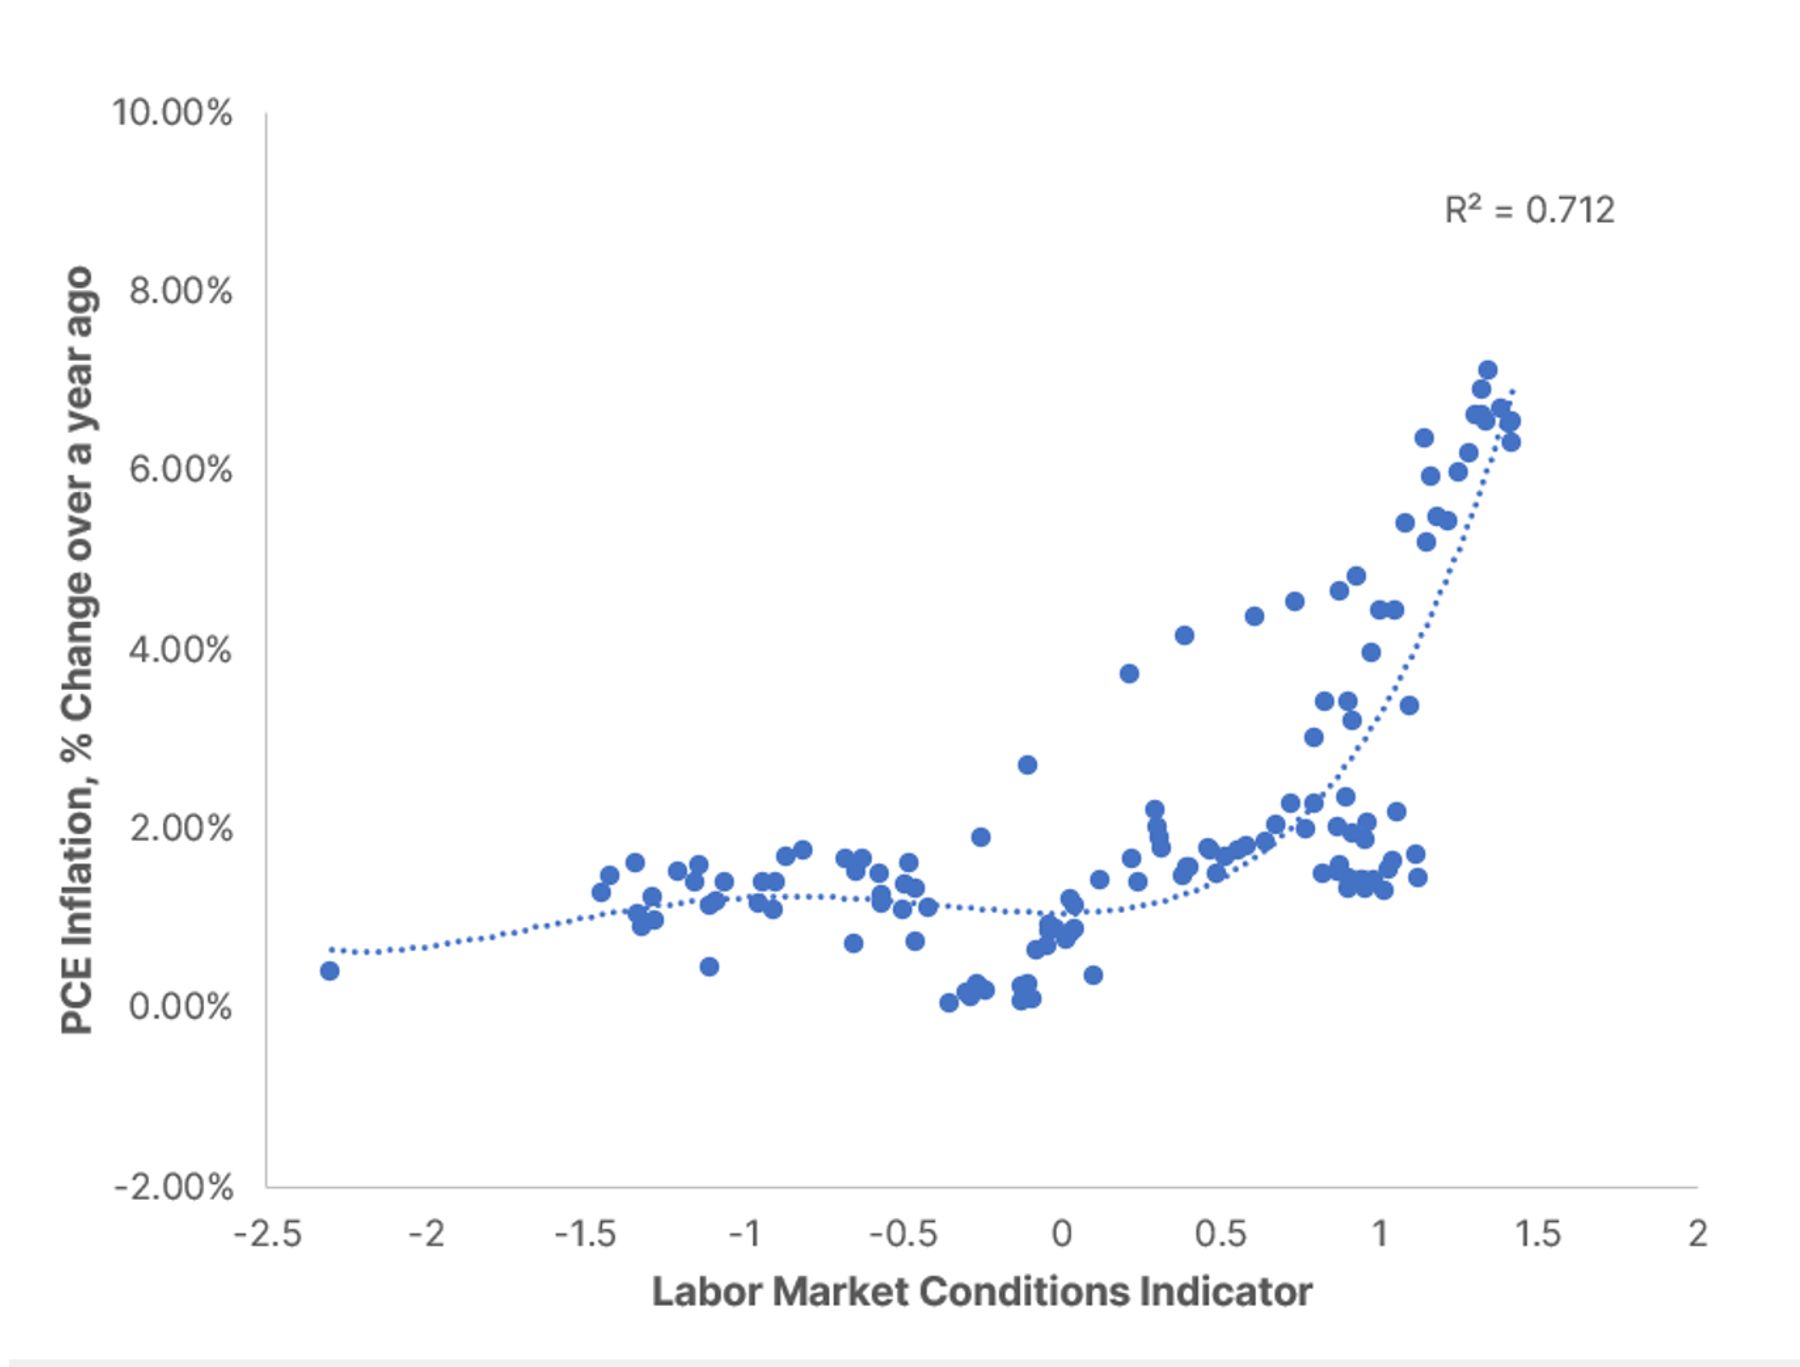
Using the LMCI as a broader measure of labor-market slack reveals that, contrary to the White House’s framing of the inflation story, the Philips Curve relationship remains intact—a stronger labor market is unambiguously associated with stronger inflation. Indeed, a simple polynomial regression of PCE inflation on the LMCI explains 71 percent of all the variation in inflation over the last ten years. That means that labor-market slack is an overwhelmingly powerful explanation for inflation; only 29 percent of the variation in inflation is explained by factors not captured by the index, such as random fluctuations, supply chains, measurement error, or inflation expectations.
This extremely simple model has several important features. First, the relationship it depicts is strong and statistically robust. Second, the model displays the predicted nonlinearity, meaning that inflation rises more dramatically as the labor market gets tighter. Third, the Philips Curve model was flat when the labor market wasn’t very tight, in keeping with the low inflation of the early-to-mid 2010s.
LMCI-based Philips Curve
This picture is also consistent with Edmund Phelps and Milton Friedman’s idea of a “natural rate of unemployment,” suggesting that government efforts to stimulate the economy and push unemployment below some floor will result in higher inflation. The labor market can be pushed only so far before prices zoom up. As Yellen pointed out a decade ago, the problem with CEA’s analysis is that the unemployment rate doesn’t contain all the information we need about the labor market. Other indicators, like the number of job openings per unemployed worker, have rocketed to new highs in recent years, indicating a much tighter labor market than the unemployment rate suggests.
The White House wants to argue that demand pressures from excessive stimulus explain only a small portion of recent inflation for two reasons. First, if it were true, it would exonerate the administration and Congress. Inflation would be due to bad luck and forces outside their control. This argument is hard to accept, no matter how much the administration pushes it. Christine Lagarde, president of the European Central Bank and someone with no bone to pick in American politics, attributes to U.S. fiscal policy a key role in driving European inflation. If American policy were a major driver of European inflation, it must be even more so for U.S. inflation.
The second reason the Biden administration wants to downplay the effect of its spending is that if excess demand played only a small role in recent inflation, policymakers would be free to pursue the same policies again without fearing a resurgence of high prices. They could spend trillions more on stimulus, cut interest rates, and pursue every social-welfare dream with no material consequences.
Clearly, attempts to stimulate the labor market far beyond its potential contributed to inflation’s severity and persistence. Allowing politicians to redefine the recent inflation surge as the outcome of bad luck would set the stage for a repeat of the worst macroeconomic policy mix in decades—and a return of our inflationary travails.
Photo by Michael Ciaglo/Getty Images