
The U.S. economy surpassed expectations by adding 353,000 jobs in January, according to the employment report released on February 2 by the Bureau of Labor Statistics. According to BLS, the economy added 3 million jobs in 2023, and the unemployment rate remains at 3.7 percent, roughly where it has been throughout this year so far. The report suggests that the labor market is still unusually strong, with no sign of a recession on the horizon.
At the same time, Americans are dissatisfied with the state of the economy. More than 60 percent of respondents to a late-January NBC poll said that they disapproved of President Biden’s handling of the economy, a figure that has held steady throughout the past year and is in keeping with other recent surveys. The president has expressed frustration with this, understandably: a stream of strong employment reports is usually a good sign for an incumbent president.
Finally, a reason to check your email.
Sign up for our free newsletter today.
What explains the gap between the BLS data and public opinion? BLS’s recent employment report may have overestimated job growth due to its seasonal and benchmark adjustments. Respondents’ negative assessment of the economy may also reflect their concern about rising prices and interest rates rather than unemployment.
The most plausible explanation may be related to the BLS data itself. BLS uses two surveys to assess employment and the labor market. First is the payroll survey of businesses and government agencies, sometimes called the “establishment survey,” which BLS uses to estimate the total level of employment across the economy. The bureau monthly surveys 119,000 businesses and government agencies, which cumulatively represent 629,000 worksites of the more than 30 million nationally. BLS uses the results to estimate economy-wide employment levels, the number of jobs gained or lost in the preceding month, and employees’ hours worked and earnings. This is the survey referred to in the monthly jobs report.
Second is the household survey, which consults some 60,000 households across the country of more than 120 million nationally. BLS uses the results to estimate the size of the work force, the number of people employed and unemployed, their status as full-time or part-time workers, the size of the civilian labor force, and the demographic characteristics of the work force and labor market.
The BLS combines results from these two surveys to generate its monthly employment reports. The payroll survey is used to estimate the number of jobs gained or lost during the previous month, while the household survey is used to estimate the unemployment rate, the number of part time and full-time workers, and the demographic characteristics of the work force.
The two surveys vary in their month-to-month estimates of employment gains and losses and in the general economy-wide employment levels. This is not surprising, since the two tap different populations—one is a survey of households, the other of employers. The two surveys also use different measures of employment and unemployment. The payroll survey, for example, includes only workers who received pay during the month, while the household survey counts as employed those on leave or unpaid workers in family businesses. For this reason, the household survey reports higher employment levels than the payroll survey. As of this January, the household survey estimated that 161.1 million Americans were employed; the payroll survey estimated 157.7 million.
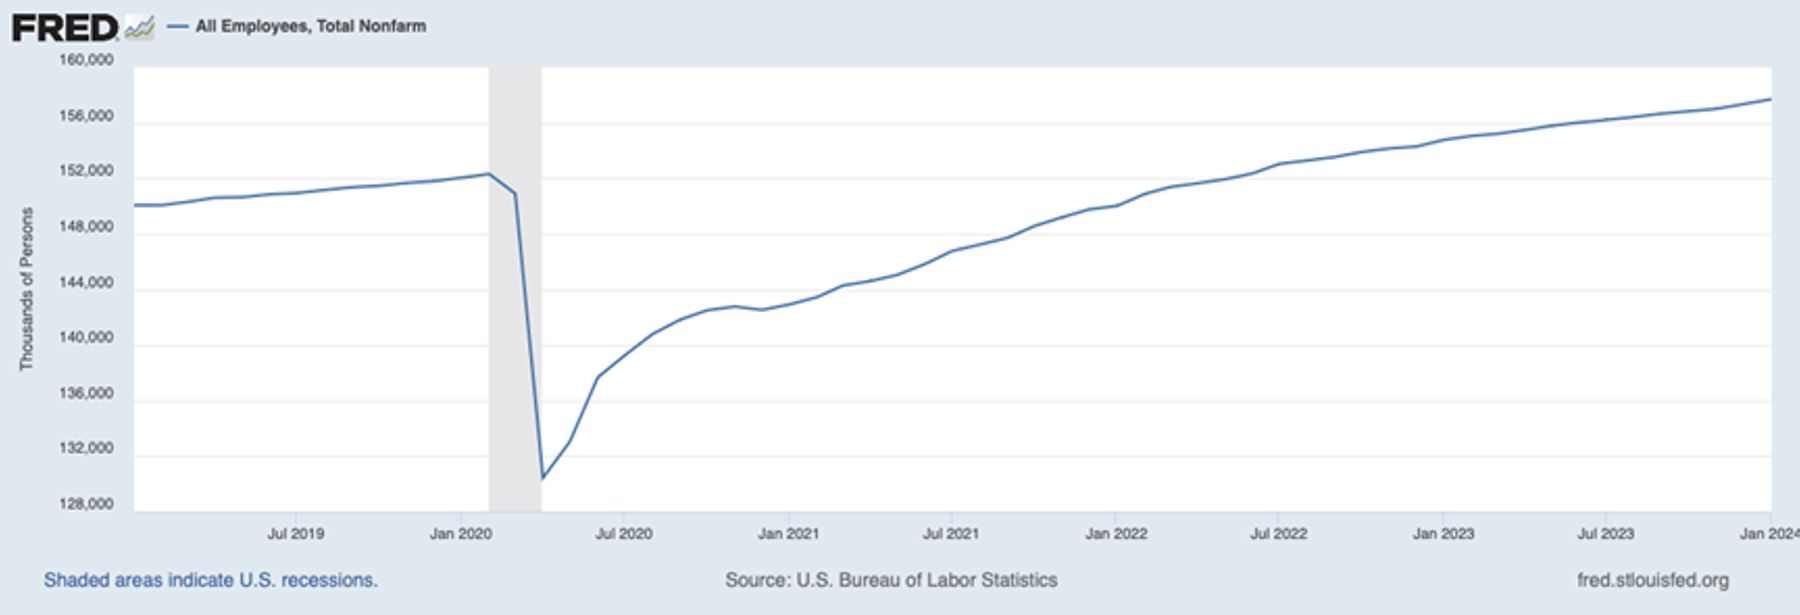
The payroll survey has reported robust gains in employment over the past five years, as illustrated in the chart below published by the Federal Reserve Bank of St. Louis. While January’s 353,000–job increase was impressive, it was preceded respectively by 333,000– and 182,000–job increases in December and November, both of which ran well ahead of predictions. All told, the payroll survey tells an impressive story of job growth and resilience in the U.S. economy, especially considering that these gains in employment occurred in an environment of steadily rising interest rates.
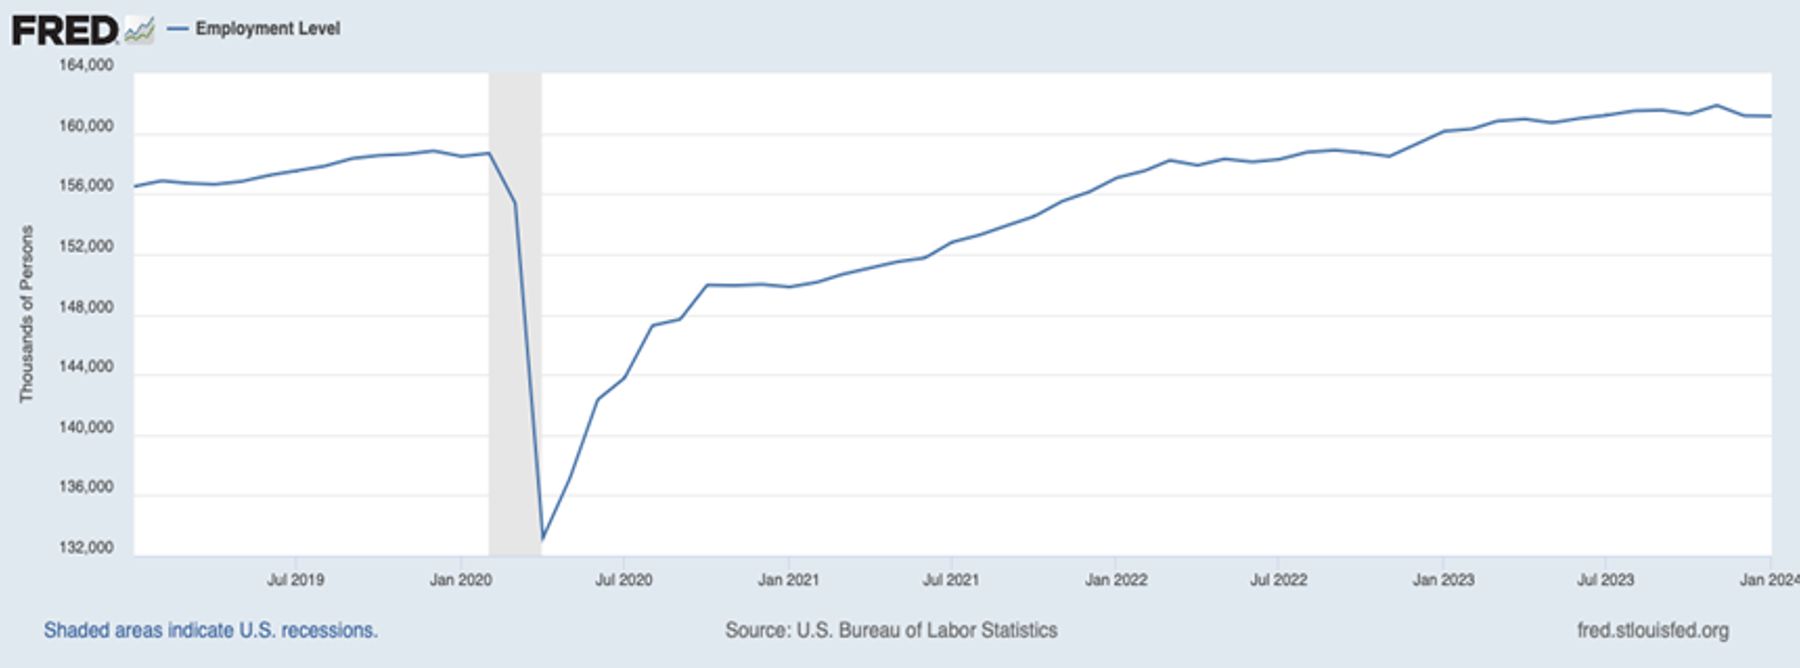
The household survey, however, tells a different story. The chart below depicts month-to-month estimates of total U.S. employment based on surveys of consumers and employees. According to that survey, employment actually fell by 31,000 workers from December to January, and by some 700,000 over the two-month period from November to January, compared to the 353,000 and the 686,000 increases respectively reported in the payroll survey. That adds up to a difference between the two surveys of some 1.4 million jobs between November and January. Over the past year, the household survey reported that the economy added 1 million new jobs—2 million fewer than the payroll survey’s estimate.
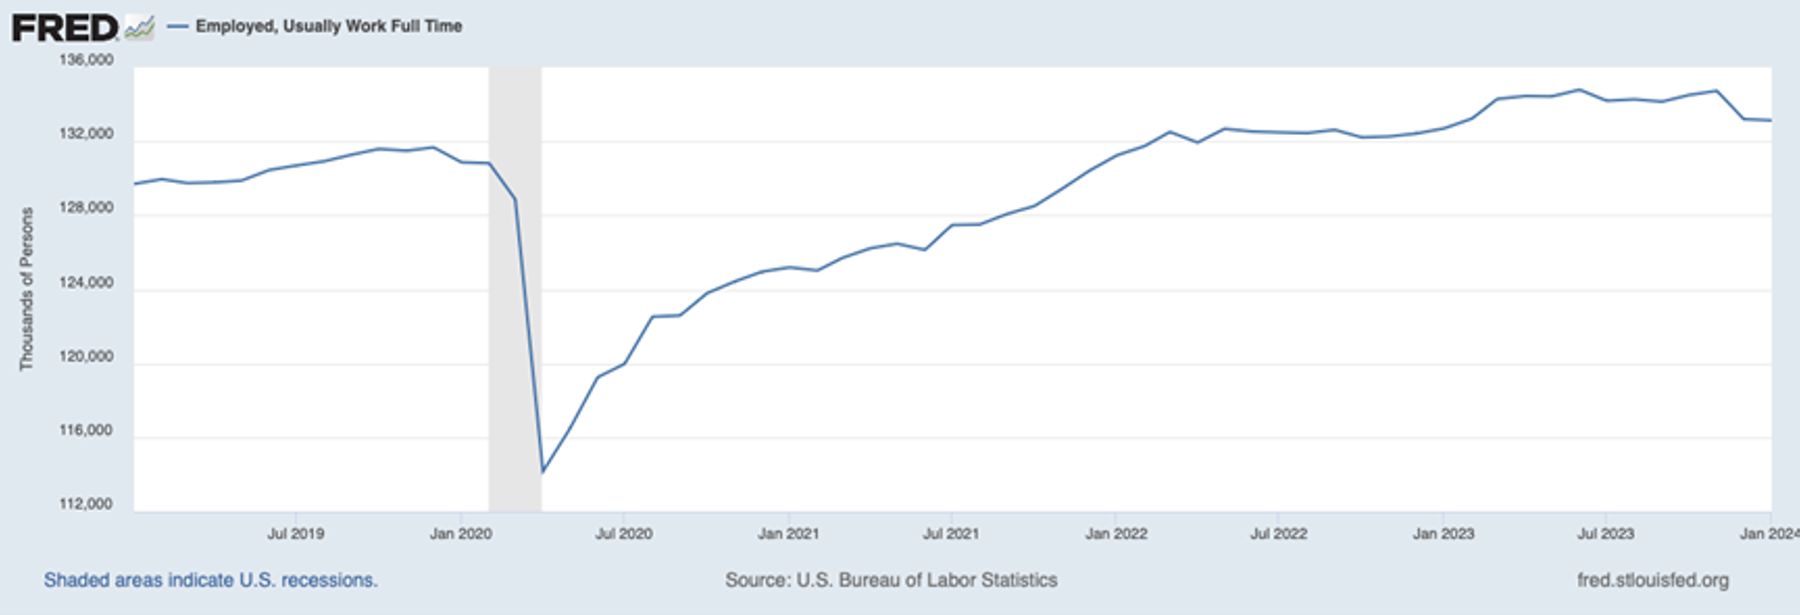
Another difference between the two surveys is how they classify workers. The household survey counts full-time and part-time workers separately, while the payroll survey doesn’t draw that distinction. When we look at full-time employment levels estimated by the household survey, we see another side to the American employment picture. The chart below depicts month-to-month changes in the household survey’s estimate of the number of full-time employees across the economy. According to these estimates, full-time employment fell by some 1.6 million workers from December to January, compared with the 353,000–job increase reported in the payroll survey. Between July 2022 and January 2024, the economy added just 600,000 new full-time jobs, or 33,000 per month, compared with the payroll survey’s 5 million–job expansion estimate for the same period.
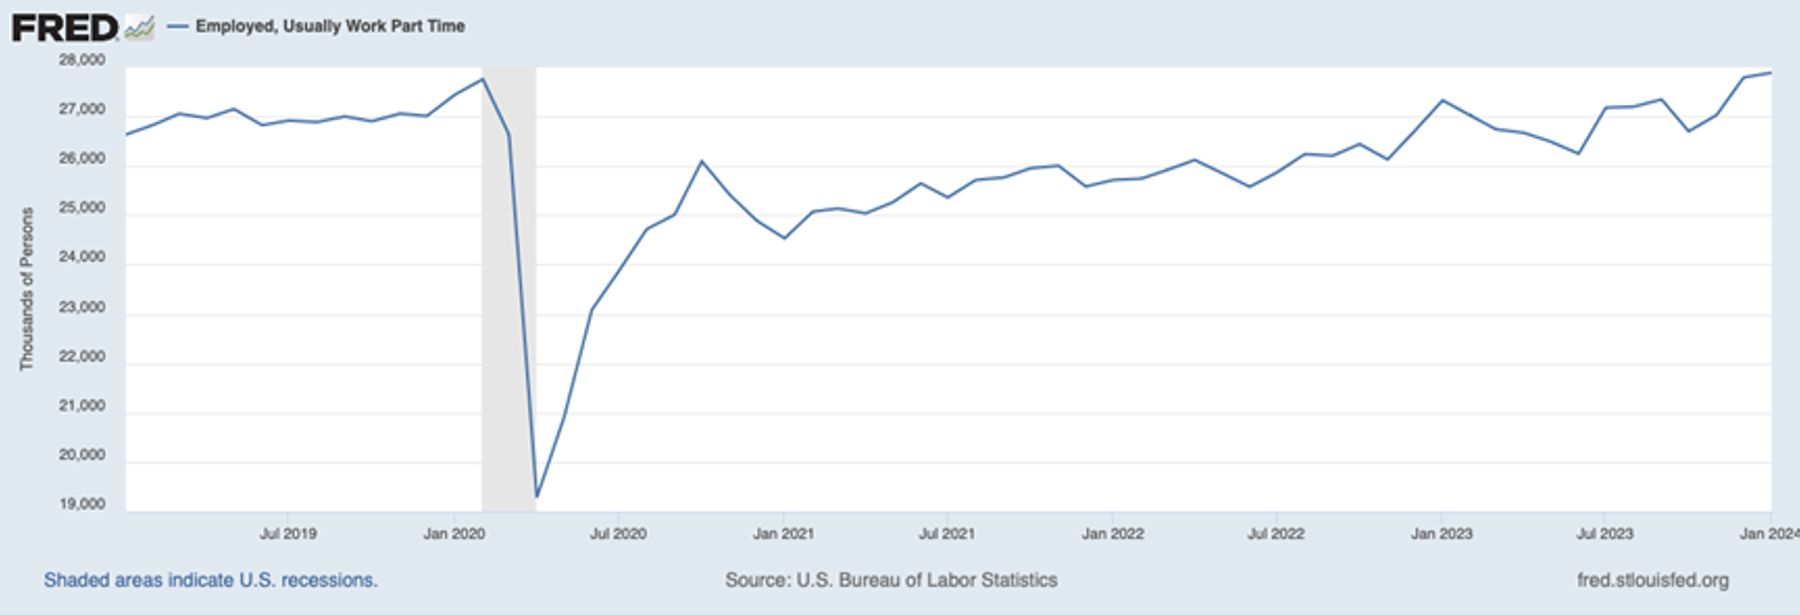
The gap between the payroll survey’s employment estimates and household survey’s full-time employment estimates are largely explained, of course, by part-time workers. The household survey estimated 100,000 new part-time jobs in January and an impressive 900,000 new part-time jobs between November through January. Therefore, according to the household survey, the increase in total employment over this period was due to increases in the number of part-time employees. Over the full year, from January to January, part-time employment grew by 600,000—about 60 percent of all job gains made during the course of the year.
While the unemployment rate remains low according to both surveys, the household survey provides a clearer depiction of the job market, and an explanation for the public’s frustrations. The labor market’s success has been fueled mostly by part-time-job growth, rather than by the addition of full-time jobs. The household survey suggests an explanation for why Americans don’t perceive a robust labor market: from their point of view, it isn’t robust.
The disparity between the two surveys should caution those who follow monthly employment reports to look beyond the headline numbers in the payroll survey to see whether they are consistent with estimates in the household survey or with employment estimates provided by ADP and other firms that follow the job market. If those figures do not match, then it’s fair to conclude that the employment picture is more complicated than portrayed by the headline numbers.
Photo: Zero Creatives/Image Source via Getty Images