
Last April, shortly after New Jersey governor Phil Murphy proposed a budget with hundreds of millions of dollars in new taxes, his Texas counterpart, Greg Abbott, published an op-ed in the Garden State’s largest newspaper, inviting businesses and residents to consider moving south. “I’d like to throw a lifeline to businesses and families throughout New Jersey who are looking for greater economic opportunity and relief from high taxes. Come to Texas and be a part of our economic success story,” wrote Abbott. “Combine our low taxes and reasonable regulatory environment with our access to global markets and our robust infrastructure, and it’s easy to see why the Texas economy continues to flourish.”
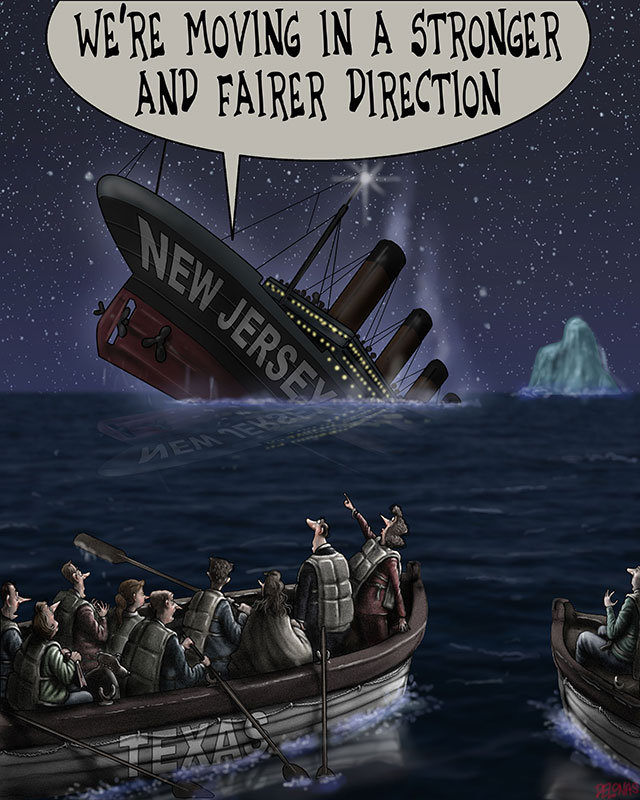
Shortly afterward, Murphy responded in the Dallas Morning News, explaining that his budget sought to move Jersey in a “stronger and fairer” direction, after years of putting “the wealthy and big corporations ahead of ordinary people.” He didn’t explain how his state—with the nation’s third-highest corporate income tax and its worst business climate—had put “corporations ahead” of ordinary people. Nor did Murphy clarify how Jersey, where the top 1 percent of households pays 38 percent of the income taxes, favored “the wealthy.” Instead, the governor touted what he considered Jersey’s strengths—among them, lots of “investment” in things like education—as a reason for firms and residents to stay put.
Murphy’s stance was typical of officials in high-tax states, who’ve long argued that businesses and families care about more than just taxes. They also want quality government service, on this view—and are willing to pay extra for it. In late 2017, when the Trump administration proposed nixing the federal exemption for state and local taxes, defenders of the policy, mostly from high-tax Democratic states, said that ending it would hurt them by making local taxes more expensive to residents.
But this decades-old argument about the payoff from high taxes is increasingly at odds with reality. In polls asking whether residents and businesses want to leave a state, the most discontented respondents come from heavily Democratic and high-tax states. Many who say that they plan to leave say that taxes are indeed a factor. But lurking in the data are other reasons, including mounting discontent with what residents actually get for their tax dollars. Independent studies show that on the core tasks that people think government should do—building roads and bridges, running airports and transit systems, or otherwise spending tax dollars well—high-tax states rank low, despite enormous financial resources. States that tax a lot also tend to regulate heavily, and that has emerged as another underlying cost that this high-tax, high-spending model imposes on citizens and businesses. Of course, not all Democratic-leaning states are high-tax, heavily regulated environments, and not all Republican-leaning states deliver great services at low prices. But, Republican or Democratic, low-tax states are less likely to overcharge residents for government failure because they don’t automatically view government as the answer to public problems.
“In New Jersey, we are moving in a new direction,” Murphy wrote in his Dallas Morning News piece. An unfamiliar reader might assume that the state was catching up after years of low taxes and underinvestment. But Jersey has been one of the nation’s most heavily taxed states for decades—and its financial woes date back more than 20 years. The question that Murphy and other big-government advocates ignore: What happened to all the money?

Every few years, Gallup asks Americans whether they want to leave their state. The results vary dramatically. Less than a quarter of people in Montana, Oregon, Washington, Colorado, South Dakota, Texas, and Maine say that they want to leave, but more than 40 percent in New Jersey, Connecticut, Illinois, Rhode Island, and Maryland are looking to move. Seven of the eight places that people are most eager to flee rank solidly Democratic in party affiliation; most, like New Jersey, Connecticut, and New York, are high-tax environments. By contrast, the states with the smallest percentage of people wanting out include Democratic-leaning and Republican-leaning states, but they’re all low-to-middle-tax states—Oregon and Washington have among the lowest tax burdens of any Democratic-leaning states, for instance. Summing up this pattern, Gallup observed: “Even after controlling for various demographic characteristics including age, gender, race and ethnicity, and education, there is still a strong relationship between total state tax burden and desire to leave one’s current state of residence.”
These results have stayed consistent for years, and migration data reflect them. A study by demographer Wendell Cox of net flows of migrants from state to state found that seven of the ten states with the most net out-migration are Democratic: California, Connecticut, Illinois, Maryland, Massachusetts, New Jersey, and New York. By contrast, the states winning the most residents were either Republican, politically neutral, or low-tax Democratic places—including, again, Washington and Oregon.
Still, taxes aren’t the only reason people give for leaving or hoping to leave. When Monmouth University’s polling institute asked Jersey residents, 30 percent listed taxes as a reason, the largest group. But 24 percent said that the overall high cost of living soured them on the state, and 28 percent listed reasons relating to quality of life, from government corruption and traffic congestion to lack of opportunity. A similar poll taken of the state’s businesses in January of last year found that twice as many planned to expand elsewhere rather than keep growing in-state. While taxes were their biggest gripe, business executives rated quality-of-life problems close behind, with only 24 percent deeming New Jersey a better place to live than other states.
What do residents generally want from local government, and how do the states with heavy out-migration perform in those areas? In most polls, infrastructure—especially roads, bridges, and airports—ranks high among the basic things that citizens and businesses expect government to provide. Given how much revenue high-tax blue states rake in, this should be an area where they vastly outperform their peers—but the opposite is true. In its annual rankings of the best and worst places to do business in America, CNBC collects data on everything from roads and airports to water systems and ports, and then grades states on their performance. Among the bottom ten—that is, the places with the worst-rated infrastructure—are six Democratic states, which also rank among the highest in taxes collected per resident: Connecticut, Hawaii, Maryland, Massachusetts, New Jersey, and New York. No Democratic state makes the best-infrastructure list.
Even more startling, several top-rated states for infrastructure are among the lowest taxed. Governor Abbott’s Jersey-poaching Texas boasts the top overall ranking. “No state ships more goods to more places than Texas,” observes the study, and Texas, on average, does it better than other locales. Also scoring within the top ten: Tennessee, which collects the second-lowest state and local taxes per capita; Florida, ranked fourth lowest in taxes; and Utah, with the eighth-lowest burden. Judging by the list, an almost inverse relationship exists between the resources that state governments take in and how effectively they build and maintain infrastructure.

Within the broad category of infrastructure, airports remain a vital regional amenity. When they’re thinking about location, businesses consider the quality of an area’s airport as key, and local residents naturally prize it, too. But airports in blue-state, high-tax regions tend to be loathed. In recent J. D. Power polls, the lowest-rated American airports among travelers were LaGuardia in New York City, along with Newark Liberty, Philadelphia International, Fort Lauderdale–Hollywood International, Chicago O’Hare, New York JFK, Los Angeles International, Honolulu Inouye International, and Boston Logan—almost all serving blue states. Some blue-state airports are so bad that they’re rated worse than airports in developing countries. Former vice president Joe Biden infamously described LaGuardia as a “Third World” airport.
To understand the degree of failure reflected in these rankings, consider the three New York airports, all managed by a nearly century-old bistate agency, the Port Authority of New York and New Jersey. The authority’s operating philosophy illustrates the shortcomings of the high-tax, high-fee, heavily regulated blue-state regime. The agency’s board members and top officers are appointed by the governors of the two states. Though it receives no tax revenues from the states, its control of key regional infrastructure gives it enormous taxing power in the form of fees, tolls, fares, and rents that it collects everywhere from bridge and tunnel crossings to the airports themselves. The airports have proved especially lucrative, generating some $600 million yearly in operating income, which the authority uses to subsidize lavish salaries and benefits for workers and politically favored, but super-costly, money-losing building projects. Much of this has come at the expense of reinvestment in the airports.
Newark Liberty’s biggest tenant, United Airlines, sued the Port Authority, claiming that its gate fees were unjustifiably the nation’s highest and that, among other things, the money was paying for an airport police force that was, by any reasonable standard, extravagantly compensated. A 2016 City Journal analysis found that Port Authority police, on average, received $153,784 in salaries, starting with a base pay of $90,000 for top officers, with overtime adding tens of thousands more. Sergeants earned more than $182,000 that year, making them among the highest-paid cops in America. And it wasn’t just the police. Electricians working for the agency’s rail lines took home an average of $111,000 annually, and even toll collectors raked in more than $85,000 annually.
Rich with fees, the Port Authority also embarks regularly on pricey building projects, which go wildly over budget. It commissioned, for instance, a $2 billion station to replace the PATH terminal destroyed by the 9/11 bombings; already obscenely expensive for what was basically a new subway station, the project ultimately cost $4 billion to finish, sucking money from the airports and miring the agency deep in debt.
A major driver of these costs is the alliance between left-leaning politicians (mostly, but not exclusively, Democrats) and public-sector unions—what Walter Russell Mean defines as the blue-state model. Under this alliance, as state and local budgets have fattened, public employees have captured a growing percentage of the rising revenues. Connecticut, the state with the second-most heavily unionized public workforce, introduced an income tax in 1991 signed into law by an independent governor who had spent most of his career as a liberal Republican. Since then, according to a Yankee Institute report, state revenues have expanded 71 percent faster than inflation. But core spending needs haven’t been the main priority. The fastest area of budgetary growth: spending on employee benefits and debt payments—appropriately termed “nonfunctional spending.” The high benefit costs set public workers in Connecticut apart from their private-sector counterparts. One study found that two employees with equal education—one working in government and the other in the private sector—would earn similar salaries in the state, about $70,000 yearly. But while the private-sector worker would typically enjoy the equivalent of $29,000 a year in employee benefits, the public-sector worker gets anywhere from $54,000 to $75,000 annually in pension, health, and other benefits.
Union-friendly laws make it tough to restrain these costs. Illinois’ pension woes, among America’s worst, keep deepening because of unusually powerful constitutional protections, which prohibit the state from altering the rate at which public workers earn retirement credits, even for work they haven’t yet done. This is profoundly harming the state’s viability. When Illinois hiked corporate and individual taxes in 2011 by some $7 billion a year, more than half of the increase went right into the pension system, instead of paying for, say, improved schools or roads. Similarly, Chicago, with the lowest-funded municipal pensions of any major U.S. city, raised property taxes by half a billion dollars in 2016, just to afford its required pension payments. “The blue model is breaking down so fast and so far that not even its supporters can ignore the disintegration and disaster it now presages,” Mead observes. “The blue model can no longer pay its bills, and not even its friends can keep it alive.”
Blue-state governments also tend to spend more to build. Tunnel construction is cripplingly expensive in places like New York City and Boston, for instance. While Europe and Japan typically build tunnels for between $200 million and $660 million a mile, according to calculations by Israeli mathematician Alon Levy, New York’s Number 7 subway extension cost $2.1 billion per mile, while its Second Avenue subway line cost about $2.4 billion per mile. The estimated bill for the East Side Access tunnel, a project to connect the Long Island Rail Road to Grand Central Terminal, is a mind-boggling $8.8 billion per mile. Meantime, an aboveground extension of the Bay Area Transit in San Francisco will bill taxpayers about $170 million a mile, almost as much as it costs in some European countries to build subways underground. (See “Why Can’t New York Control Its Infrastructure Costs?,” Summer 2018.)
The chief culprits are extraordinary labor charges, cumbersome union work rules, and political turf battles that governments in Europe, Asia, and other U.S. states somehow manage to avoid. Featherbedding is typical in blue-model states. Tunnel-boring machines in New York are manned by up to 25 workers—twice as many as in nonunion states and nearly four times as many as in Germany. One government audit found that 200 of the 900 tunnel workers employed on the East Side Access project seemed to have no discernible job. Because East Side Access involved the Long Island Rail Road working on some Amtrak-controlled land, unions at the two railroads fought over who should get the work. A labor arbitrator essentially awarded the work to both, leading to absurd overstaffing. One portion of East Side Access, constructed on Amtrak land, came in three years late, at nearly triple the original $137 million price tag. And labor costs far exceed those of anywhere else in the world. Unionized tunnel workers receive $111 an hour in New York, compared with $38 an hour in Detroit and less than $40 an hour in Germany.
Citizens pay for this not just in higher taxes and fees, but in reduced efficiencies. In early 2017, only 65 percent of New York City’s subways arrived on time, down from 86 percent five years ago, as the system’s aging switches and tracks malfunction. These delays have occurred even as the subway system’s revenues—paid for in part by taxes levied on New Yorkers—have risen robustly, from a little more than $8 billion in 2001 to nearly $16 billion today. Unfortunately, costs have increased far more rapidly, at 53 percent above the inflation rate since 2005. Among the bills: $1.9 billion for employee health care, projected to swell to $2.6 billion in four years. Experts have calculated that the system spends 50 percent more per mile to move subway passengers than similar-size metro service in London and Paris. One result is talk of service cutbacks and higher fares amid warnings from ratings agencies that the whole heavily indebted, subsidized system could run out of money.
Blue-state government policies send building costs soaring higher. A New York state law requires contractors to pay a “prevailing wage”—essentially, union wages—on the billions of dollars in state and municipal building projects under way. That elevates the price tag by 15 percent to 25 percent on the construction, an Empire Center study finds. New York City’s school system will spend $1.4 billion in extra construction payments over the next five years, and state efforts to renovate Manhattan’s Javits Convention Center and finish work on the borough’s Moynihan Station will cost about $340 million more. Along with higher wages, the directive requires contractors to follow union work rules, which pad the bill further. “So, for example, on a high-rise New York construction site, highly paid operating engineers must stand by to push the buttons on fully installed automated elevators,” observes the Empire Center’s E. J. McMahon.
Advocates for unionized workers in high-tax states often claim that government is right to demand that workers get paid more, because living in such places is expensive. They ignore how government itself affects the cost of living. High property taxes make owning or renting a home more of a financial burden; excessive corporate taxes and fees force firms to charge customers more. Regulations and mandates have a similar impact.
Maddening housing regulations are a blue-state-model specialty. States where residents are most dissatisfied with the availability of affordable housing are overwhelmingly high-tax Democratic locations, according to Gallup. Demographer Wendell Cox annually analyzes home prices and median incomes in major housing markets. American cities ranked among the least affordable: Los Angeles, New York, San Francisco, and San Jose. By contrast, the most affordable cities include Dallas, Houston, Atlanta, Indianapolis, Pittsburgh, Oklahoma City, and Cleveland. Some of the price discrepancies are demand-driven (New York is a more successful city than, say, Cleveland), but even rapidly growing red-state cities like Dallas, Atlanta, and Oklahoma City have kept housing prices moderate. One reason, suggest economists Edward Glaeser and Joseph Gyourko in a 2002 paper, is that blue coastal cities, in particular, pile on zoning and other restrictions that push up land and construction costs, making it less profitable for developers to build, thus reducing supply. “[H]igh prices have little to do with conventional models with a free market for land. Instead, our evidence suggests that zoning and other land use controls play the dominant role in making housing expensive,” they state.
More recent research by economists Peter Ganong and Daniel Shoag reinforces the point. Metros like Los Angeles and San Francisco are producing new housing at only half the rate of growing areas around the country, such as Dallas or Indianapolis. Zoning restrictions are chiefly to blame for housing shortages, Ganong and Shoag found in a 2015 study. Another recent study found that 15 communities in the heavily regulated Boston region allowed just 4,062 new housing units per year—far below the 14,000 needed to ease the area’s housing crunch. The difference in housing production between red and blue regions illumines the two American urban models, suggests Bloomberg columnist Virginia Postrel. “One encourages a growing population, fosters a middle-class, family-centered lifestyle, and liberally permits new housing. It used to be the norm nationally, and it still predominates in the South and Southwest,” she writes. “The other favors long-term residents, attracts highly productive, work-driven people, focuses on aesthetic amenities, and makes it difficult to build.”
Blue-state-model political enthusiasms make it harder for average citizens to afford basic necessities. Take energy. California, seeking to slash greenhouse-gas emissions to 40 percent below 1990 levels by 2030, has mandated a shift from more affordable fossil fuels to highly subsidized renewables; its energy costs have risen 50 percent above the U.S. average, notes a Chapman University report. A 2015 Manhattan Institute study estimated that 1 million Californians now live in “energy poverty,” defined as spending more than 10 percent of one’s income on energy. Otherwise left-leaning legislators from California’s lower-income minority districts have complained to the state’s Democratic leadership that the Green crusade is “weakening the economy . . . and hurting the most vulnerable members of our communities.” Even if California reaches its lofty emissions goal, it will reduce greenhouse gases worldwide by less than 1 percent.
The costs of the blue-state model have brought significant changes in migration patterns, which have, in turn, heightened inequality, according to Ganong and Shoag. In fact, nine of the ten states where inequality has grown most over the last quarter-century are Democratic-dominated, and every one taxes residents at higher rates than the national average. By contrast, every state where inequality has grown the slowest in that period is either politically neutral or Republican-led. These figures underline the utter failure of one frequent political justification for high taxes—to redistribute income from the rich and businesses to lower-income residents and thus make society “fairer,” as Governor Murphy claimed in his letter to Texans. The more that blue-state politicians talk about inequality, it turns out, the worse it becomes in their states.
In general, the blue-state model makes life more difficult for lower-income residents. The Census Department’s Supplemental Poverty Measure adjusts state poverty levels by the local cost of living, essentially measuring how many more people wind up in poverty based on state costs. Under that measure, California has the nation’s highest poverty level, at more than 20 percent of the population. More pointedly, of the 12 states where the poverty level has worsened based on local costs, seven are solidly blue, including Connecticut, Massachusetts, New Jersey, and New York; the rest are politically neutral.
The blue-model states leave not just their poorer residents behind, but also whole regions. Areas that specialize in highly productive industries like finance or technology can absorb the impact of high taxes and intrusive regulations easier than cost-sensitive manufacturing or agricultural sections. While the greater San Francisco–Silicon Valley area has prospered in the latest economic expansion, five of the nation’s ten metros with the worst unemployment rates are in California. New York’s economic rebound from the last recession was powered almost entirely by New York City. The state has added about a million jobs since the recovery began, but about 730,000 have been in Gotham. Four large upstate areas have actually lost jobs.
Higher state spending can bring some apparent advantages. Blue-model states spend gigantic sums on their public schools, from 50 percent to nearly 100 percent above the national average per student in places like New York and New Jersey. That’s paid off in terms of quality, according to a study by the financial website 24/7 Wall St. The list of top public schools by state includes Massachusetts, New Jersey, and New York. Government spending and quality may be more closely correlated in public education because school systems aren’t controlled by state bureaucracies but by local school boards—where parents, especially in smaller suburban towns, can demand accountability.
Still, fast as some of these states educate young people, they’re losing them as residents. From 2011 through 2015, the three top states exited by millennials (people aged 23 to 38) were heavily Democratic: New York, Illinois, and New Jersey, according to one study based on census data. (Fourth on the list was politically neutral Pennsylvania, whose taxes and overall costs are relatively modest, except for property taxes, which have been rising to pay for schools.) That study also found that the five states attracting the most millennials were less costly, Texas and Colorado among them. A report drawing on more recent data by a New Jersey group found that young people, not retirees, were the biggest demographic group fleeing that state. The data belie the explanation of some politicians, like New York governor Andrew Cuomo, that blue-state out-migration is largely about retirees leaving for warmer climes.
One challenge that the blue-model states have in retaining younger people is mediocre public universities—with the notable exception of California, whose 1960 Master Plan for Higher Education, engineered by then-governor Edmund “Pat” Brown, elevated that state’s system. The U.S. News & World Report list of the top 11 (there’s a tie for tenth place) state-subsidized universities includes the University of Michigan, the Georgia Institute of Technology, the University of North Carolina at Chapel Hill, and the College of William and Mary, as well as six units of the California system. Beyond California, though, the blue-state model performs much less well. Rutgers University, New Jersey’s state college system, ranks only 17th academically, despite claims by Governor Murphy that Jersey has “world class universities.” (He might have been referring to Princeton University, privately founded in 1746, when New Jersey was ruled by a British colonial governor.) By contrast, the University of Texas at Austin ranks higher academically than Rutgers, and it charges in-state students 50 percent less for tuition. Similarly, the top-scoring public university campuses in Connecticut, Maryland, Massachusetts, and New York all rank even lower than Rutgers. SUNY at Binghamton, the academically best-rated public university campus in New York, is ranked just 32nd nationally.
The enormous resources of the high-tax blue states might give a resident some hope that a reformer could reshape policies to make the states more livable. Yet some of these governments also have run up fantastic debts, which will limit their options. A recent American Legislative Exchange Council study found that the states with the highest bonded debt per resident were overwhelmingly Democratic and high-tax, such as Connecticut and New Jersey. Only one state that Gallup categorizes as solidly right-leaning, South Carolina, was among the most indebted states. Though the government-pension problem is bipartisan, when you add the enormous pension liabilities of some blue-model states to their bonded debt, it’s clear that they have already mortgaged away a significant part of their future revenues. The impact of this debt can be seen already in the sharp drop in public-sector unionization in blue states. Membership reached a peak in 2008 but has never recovered from the recession; even after a nine-year economic expansion, the number of unionized government workers is down by some 350,000 members.
Of course, in many of these places, no single politician or party is responsible for the debt accumulation. Connecticut amassed some of its biggest pension debts years ago, when Republicans ran the state, and governors from both parties in New Jersey have allowed pension debts to soar over the last 25 years, even while they liberally rewarded public employees with new benefits. New York’s Republican Party has often embraced the blue-state model nearly as enthusiastically as its Democratic counterpart. Some red states also waste money on infrastructure boondoggles and mismanage pensions. More spending won’t cure what the public sector hasn’t gotten right.
In his Dallas Morning News letter, Governor Murphy told Texans: “If you’d like to be part of an economic revival in a state that recognizes the value of investments in public education, creates welcoming communities that protect LGBTQ residents and immigrants, defends a woman’s right to reproductive health care, then New Jersey is the place for you or your business.” He didn’t mention that, for years now, residents and firms have been going in the opposite direction, with Texas attracting, on average, more than twice as many Jersey residents as it loses every year to its northern rival. That’s a problem, Murphy would likely say, that Jersey could fix with just another few billion dollars of government spending.
Photo by Drew Angerer/Getty Images
